Tag Archives: month

Tactical Asset Allocation – May 2016 Update

Here is the tactical asset allocation update for May 2016. Before I get into the updates for the month I want to share a must read post from Antonacci. In the post he lists some questions he often gets asked about markets and investing. Here they are: Question: How much do you think the stock market can drop? Response: 89% Question: What?!! Response: Well, that is the most it has dropped in the past. But past performance is no assurance of future success, so I guess it could go down more than that. Question: I just looked at my account, and it is down. What should I do? Response: Stop looking at your account. Question: What are you doing now? Response: What I always do … following my models. After these responses, I am usually not asked any more questions. This is so on point. I have very similar experiences. I’ll add a few more. Q: What are you investing in now? A: Uhh, whatever is going up, or cheap, or both… or I’ve also said, don’t know I’d have to check my computer to tell you. Q: If I do answer the above with a specific investment, which is usually a mistake, then I get, the why? A: Because the computer/model said so… Q: What do you think about X? (where X=China, Junk bonds, liquidity, etc..) A: I have a lot of personal opinions about those things but for investing I don’t care. Doesn’t matter. After these answers the conversation usually turns to something else, like craft beer… Below are the updates for the AGG3, AGG6, and GTAA13 portfolios. The source data can be found here . The sheet contains the IVY5, GTAA5, and the Permanent Portfolio as well. These signals are valid after every trading day. So, while I’ll maintain these month end updates this means that you can implement your portfolio changes on any day of the month, not just month end. FINVIZ will at times generate signals that are slightly different than Yahoo Finance. Also, year to date performance figures have been updated and are included in the sheet. Note: I am not maintaining the Yahoo Finance versions any more. All portfolios now use FINVIZ data. Click to enlarge For May there are no changes to AGG3. For AGG6, VCIT and VBR are new holdings. Both portfolios are 100% invested. For GTAA13, only GSG remains in cash mode. Approximate monthly and YTD performance is below. In a new change global asset allocation is still working well in 2016. Click to enlarge For the Antonacci dual momentum GEM and GBM portfolios, GEM remains in SPY , and the bond portion of GBM is in MBB . The Antonacci tracking sheet shareable so you can see the portfolio details for yourself. The Bond 3 quant model , see spreadsheet , ranks the bond ETFs by 6 month return and uses the absolute 6 month return as a cash filter to be invested or not. The Bond 3 quant model is invested in IGOV , VGLT , and MUB . That’s it for this month. These portfolios signals are valid for the whole month of May. As always, post any questions you have in the comments.
Fund Managers Are A Frightened Lot!

Today we will focus on Merrill Lynch’s monthly survey of global fund managers, who overlook around $600 billion in AUM. Majority of the time, but not always, surveys such as these should be taken from the contrary perspective and include some great insights as to how the consensus is positioned. As always, there are some pretty good charts and interesting observations, so let’s get started. Click to enlarge Equity allocations remain quite low, especially when one considers the recent multi-month powerful rally in global equities. Fund managers allocations towards the stock market fell to 9% overweight this month, from 13% last month and 54% in April 2015 (just before equities rolled over). The chart above shows that data with MSCI Hong Kong, which has been one of the most oversold markets since the Chinese rout began. However, on our Twitter account readers can also see the same data with the MSCI Australia index. We would assume equities have further to run based on this data alone, however we would advise caution on using only one indicator to make your financial decisions. Click to enlarge Bond allocations remained similar to previous two months, as readings came in at 38% underweight. Worth noting however, fund managers were 64% underweight in December, just before the equity market sold off and bond market rallied. In the chart above, we have shown the difference in allocation of equities vs bonds, together with the ratio of stocks vs bonds. Globally, managers have been quite risk averse. While positioning towards the debt markets is not that extreme (allocations have risen to 20% underweight or even higher historically), there are other sentiment gauges arguing that Treasury yields could rise somewhat from here. Click to enlarge Firstly, small speculators positioning in the futures market shows dumb money is chasing Treasuries with an expectation of lower yields. Secondly, Mark Hulbert’s Bond Newsletter Sentiment Index ( click here to see the chart ) shows record bullish recommendations by various advisors and newsletter writers. Thirdly, number of shares outstanding on various Treasury ETFs has spiked in recent weeks ( click here for the chart, thanks to Tom McClellan ). Finally, according to ICI, fund inflows towards government bonds have been very elevated for weeks. Putting it all together, one can see that there is room for unwinding of positions in the Treasury bond market. We have been long for a few months now and have recently changed our duration towards very short term Treasuries and Corporate grade bonds, as we expect a correction. Having said that, Treasuries still remain attractive for three reasons: 1) relative to rest of the developed world, Treasuries look attractive and could be considered high yielding sovereigns with only Australia & New Zealand paying you more; 2) we still continue to favour assets priced in US dollars as we see the greenback resume its bull market once the current correction runs its course; and… Click to enlarge … 3) we think that longer duration Treasury yields could eventually break down from the technical consolidation patterns. Click to enlarge Finally, cash balance increased in the month of April to 5.4%, from 5.1% a month earlier. As already discussed above, despite a very strong multi-month stock market rally, fund managers continue to hold extremely high levels of cash. Risk averse behavior resembles bear markets of 2000-02 and 2007-09, however, year to date performance of all major asset classes is pretty much positive (chart below). Click to enlarge Our take on high cash allocations by fund managers requires an investor to step away from day to day activities of the financial market, and focus on the longer-term picture. We believe there is an overvaluation in all major asset classes, where global central bankers have goosed up and inflated value of just about everything. We are very nervous and seem not to be the only ones with this view (Bloomberg: Peter Thiel Says Just About Everything Is Overvalued ). Bonds and cash are more expensive than they have ever been, with yields on Treasuries lower than at any other time in the last 220 years. Europe and Japan have gone into “la-la land” of negative interest rates, something that hasn’t happened in over 5,000 years of recorded history . Cash yields essentially zero or even negative in some countries. US stocks are the most expensive ever, apart from a few months during dot com bubble, with some metrics showing future expected returns to be flat over the coming decade. Basically, we have a situation where stocks, bonds and cash are expensive all at once. Depending on how events unfold, returns on all major asset classes could be very low or even negative (in tandem). No wonder global fund managers are frightened! Original post

Growth And Surging Popularity Of Unconstrained Bond Funds

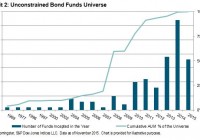
By Hong Xie In the aftermath of the global financial crisis of 2007-2008, one noticeable trend in fixed income investment is the growth and popularity of unconstrained bond funds. They have generated strong interest in the investment industry due to the flexibility they offer in duration management and the broader investment universe. Because they are not managed against a specific benchmark, unconstrained bond funds may also pose challenges for investors in understanding and measuring their performance. The global financial crisis of 2007-2008 and the economic recession that followed prompted unprecedented quantitative easing monetary policies across many countries. Not only were short-term interest rates lowered to either zero or close to zero, but quantitative easing was also adopted in places such as the U.S., the U.K., the eurozone, and Japan to flatten the yield curve and keep long-term interest rates low. As the U.S. economy continues to recover and the Fed starts to increase interest rates, many investors have concerns about holding core fixed income products with high interest-rate risk in a rising-rate environment. It is this widespread market sentiment that has driven the surging popularity of unconstrained bond funds, which offer wide latitude to fund managers on duration management and investment selection. We use fund data from Morningstar to gauge the size and growth of unconstrained bond funds. In particular, we screen for funds categorized as “U.S. OE Nontraditional Bonds” by Morningstar, while excluding those with mandates in specific sectors or with duration constraints. As of November 2015, there were 122 open-ended mutual funds with total assets under management (AUM) of USD 140 billion in our data set, in comparison with 19 funds with AUM of USD 9 billion at the end of 2008 (see Exhibit 1). Even though the first fund started in 1969, it wasn’t until after the global financial crisis of 2007-2008 that unconstrained bond funds started gaining traction among investors. Exhibits 1 and 2 show the rapid growth of unconstrained bond funds since 2008 in terms of both AUM and number of funds. Disclosure: © S&P Dow Jones Indices LLC 2015. Indexology® is a trademark of S&P Dow Jones Indices LLC (SPDJI). S&P® is a trademark of Standard & Poor’s Financial Services LLC and Dow Jones® is a trademark of Dow Jones Trademark Holdings LLC, and those marks have been licensed to S&P DJI. This material is reproduced with the prior written consent of S&P DJI. For more information on S&P DJI and to see our full disclaimer, visit www.spdji.com/terms-of-use .