Tag Archives: month

Making The Patient Sicker

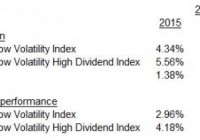
By Craig Lazzara Years ago, I saw a cartoon picturing two Victorian-era doctors discussing a patient. “What did you prescribe for Jones’ rheumatism?” asked the first; the second answered “A cold bath and a brisk walk every morning.” “Good God, man, that will give him pneumonia!” said the first. “I know,” replied the second doctor, “I made my reputation curing that.” Somehow I was reminded of this exchange when I learned from this morning’s news that some institutional investors, smarting from recent losses, are considering increasing their commitment to active equity management. Their operating assumption seems to be that active managers will do a better job of capital preservation in a challenging and volatile market. There’s certainly some plausibility to this argument. It turns out, however, to be another beautiful theory mugged by a gang of facts . The facts come from our periodic SPIVA reports, which compare the results of actively-managed mutual funds against passive benchmarks. Weak markets, it turns out, are no panacea for active managers. In 2008, e.g., 54% of large-cap U.S. funds underperformed the S&P 500. Results were even worse for mid- and small-cap managers (75% and 84% underperformers, respectively). Statistics say, in other words, that moving from passive to active as a way of managing market volatility is likely to make performance worse, not better . Fortunately for anxious investors, passive strategies which focus on the lowest volatility segment of the equity market are most likely to outperform precisely when the market is weakest. Consider, for example, the S&P 500 Low Volatility Index and its cousin, the S&P 500 Low Volatility High Dividend Index: Both of these indices are designed to attenuate the returns of the S&P 500 in both directions; historically, they have both tended to underperform market rallies but outperform when markets are weak. Their reliability as defensive vehicles has far exceeded that of active management. Investors concerned about continuing volatility and market weakness should consider indicizing their defensive strategies. Disclosure: © S&P Dow Jones Indices LLC 2015. Indexology® is a trademark of S&P Dow Jones Indices LLC (SPDJI). S&P® is a trademark of Standard & Poor’s Financial Services LLC and Dow Jones® is a trademark of Dow Jones Trademark Holdings LLC, and those marks have been licensed to S&P DJI. This material is reproduced with the prior written consent of S&P DJI. For more information on S&P DJI and to see our full disclaimer, visit www.spdji.com/terms-of-use .
The Best And Worst Of January: Long/Short Equity

Long/short equity mutual funds and ETFs posted losses in January, making it the fourth time in the past five months that the category failed to log gains. After suffering losses of 1.21% in December, the average fund in the category lost another 3.30% in the first month of 2016. This dipped the category average for the year ending January 31 into the red at -3.86%, compared to the S&P 500’s return of -0.67%. For the three-year period ending January 31, long/short equity funds have averaged annualized gains of just 2.77%. The S&P 500, by contrast, has returned +11.30% over that same time. Using the S&P 500 as a benchmark, long/short equity mutual funds and ETFs have generated -3.03% annualized alpha over the past three years, with an average beta of 0.53. The category’s three-year Sharpe ratio of 0.40 compares poorly with the S&P’s 1.03, and although long/short equity funds have had less volatility (8.30% per year versus 10.94%), it would be a stretch to characterize their aggregate performance as anything other than disappointing. Nevertheless, there were some standout performers in January, with the top fund generating gains of nearly 5%. The worst performers, however, really struggled, with losses ranging from over 10% to nearly 20%. Top Performers in January The three best-performing long/short equity mutual funds in January were: CMG Long/Short Fund A (MUTF: SCOTX ) Otter Creek Long/Short Opportunity Fund Inst (MUTF: OTTRX ) Catalyst Insider Long/Short Fund A (MUTF: CIAAX ) SCOTX was the top-performing long/short equity fund in January, posting monthly gains of 4.81%, but over the longer term, the fund’s performance has been dismal. For the year ending January 31, for instance, SCOTX returned -21.79%, and for the three-year period ending on that date, its annualized returns were -8.76%. The fund’s three-year alpha stood at a woeful -10.56%, on top of a 0.19 beta and a Sharpe ratio of -0.65. Long/short equity funds are supposed to have less volatility than long-only stocks, but SCOTX’s three-year standard deviation of 12.87% was higher than the S&P 500’s 10.94%. January’s second-best long/short equity fund, by contrast, added 3.49% in monthly gains, to bring its one-year returns to an outstanding +13.82%. These gains rank the fund at the very top of its Morningstar category, but since the fund only launched in late 2013, it doesn’t have three-year data available. CIAAX posted a 2.94% gain in January, bringing its one-year total through the end of the month to +6.37%. Over the three-year period, it posted annualized gains of 3.37%, consisting of 0.99% annualized alpha and a 0.31 beta. This gave the fund a three-year Sharpe ratio of 0.28, with high annualized volatility of 15.81%. Worst Performers in January The three worst-performing long/short equity mutual funds in January were: Catalyst Hedged Insider Buying Fund A (MUTF: STVAX ) Philadelphia Investment Partners New Generation Fund (MUTF: PIPGX ) Highland Long/Short Healthcare Fund A (MUTF: HHCAX ) STVAX, PIPGX, and HHCAX all had atrocious months in January: STVAX lost a whopping 19.24%, PIPGX fell 17.54%, and HHCAX tumbled 10.29% in just 31 calendar days. This put all three funds deep into the red for the year ending January 31: -30.28%, -33.07%, and -17.23%, respectively. All three of the worst performers have been around for more than three years, with respective returns of -12.75%, -13.64%, and +8.84% – HHCAX is the one fund with longer-term gains. Its three-year alpha, beta, and Sharpe ratio of +5.92%, 0.33, and 0.61, respectively, are better or roughly as good (its 0.33 beta isn’t as attractive as CIAAX’s 0.31) as that of any fund reviewed this month, although its three-year annualized volatility of 15.78% is among the highest of all long/short equity funds with 3-year track records. STVAX and PIPGX, by contrast, fail across the board. Their respective three-year alphas of -29.18% and -25.06%, respectively, are at the bottom of the category; their betas of 1.60 and 1.02, respectively, are among the highest in the category and much higher than that of typical long/short equity funds; their Sharpe ratios of -0.51 and -0.95, respectively, show they’re a bad risk/reward proposition; and their annualized volatilities of 21.90% and 14.29%, respectively, are far higher than that of the broad market. Past performance does not necessarily predict future results. Jason Seagraves contributed to this article.