Tag Archives: month

How To Bake A Highly Deficient Cake

What happens when you leave out a key ingredient in the recipe for baking a cake? We won’t keep you in suspense. What you get is a highly deficient cake, but how it is highly deficient can tell you quite a lot about what the omitted ingredient contributes to a competently executed cake! At Bristol Science Centre, Nerys and David illustrate what we can learn by baking four different cakes – one batch with all the ingredients the basic recipe calls for, then other batches where either the margarine, eggs or baking powder has been excluded from the recipe. The following video illustrates how the resulting cakes baked with a single missing ingredient differ from a proper cake baked with all the ingredients. The same principle applies to data analysis. For instance, if a set of economic data omits the contributions of one particular sector of the economy, and that sector turns out to contribute a large share to the performance of the overall economy, the analysis produced using such data that excludes the omitted sector’s contribution will be highly deficient, because the data itself is not adequately representative of the economy being analyzed. Much like what happens when you bake a cake without one ingredient and compare it with a cake baked with all of them, the deficiency becomes very evident when you compare the results of the deficient analysis with the results of analysis performed with data that does not omit the missing sector’s contributions. If a professional baker omitted an ingredient in a cake recipe, then their competence would certainly be at issue. If they weren’t aware that the ingredient was missing, it might all be chalked up to simple ignorance on their part – the kind of mistake that many of us all make from time to time, that we acknowledge, learn from and do not repeat. But if they were aware of the deficiency and then went on to claim that the results of their deficient recipe were just the same as a properly baked cake, then their integrity would certainly also be at issue. We wonder how many people would continue to buy the “cakes” of such a highly deficient professional baker!
Why Equity Outperforms Credit

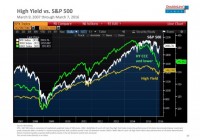
In my new paper on asset allocation I go into quite a bit of detail about why certain asset classes generate the returns they do. Understanding this is useful when thinking in a macro sense and trying to gauge why financial assets perform in certain ways in both the short-term and the long-term. It’s important to understand the fundamental drivers of these returns in order to avoid falling into the trap that these assets generate returns due to the way they’re traded in the markets. One of the more common misconceptions I see in the financial space is that credit traders are smarter than equity traders. This is usually presented with charts showing how credit “leads” equity performance or something like that. One of the more egregious offenders of this is a chart that has been going around in the last few days from Jeffrey Gundlach’s presentation showing credit relative to equity: One might look at this and conclude that these lines should necessarily converge at some point. As if the credit markets know something that the equity markets don’t. This is usually bandied about by bond traders who are convinced that stock traders are a bunch of dopes.¹ But this is silly when you think of things in aggregates because, in the long-run, the credit markets generate whatever the return is on the instruments that have been issued and not because bond traders are smarter or dumber than other people.² For instance, XYZ Corporate Bond paying 10% per year for 10 years doesn’t generate 10% for 10 years because bond traders are smart or stupid. It generates a 10% annualized return because the issuing entity pays that amount of income over the life of the bond. In fact, the more traders trade this bond the lower their real, real return will be. Trying to be overly clever about trading the bond, in the aggregate, only reduces the average return earned by its holders as taxes and fees chew into that 10% return. The “bond traders are smarter than stock traders” myth is hardly the most egregious myth at work here though. The bigger myth is the idea that equity must necessarily converge with credit over time. For instance, let’s change the time frame on our chart for a bit better perspective: If you’d bought into this notion that credit and equity converge starting in 1985 you would still be waiting for this great convergence. The reason for this is quite fundamental though. Corporate bonds only give owners access to a fixed rate of income expense paid by the issuing entity. Common stock, however, gives the owner access to the full potential profit in the long-term. If we think of common stock as a bond then common stock has essentially paid a 12% average annual coupon over the last 30 years while high yield bonds have only paid about a 8% coupon. In the most basic sense, credit and equity are different types of legal instruments giving the owner access to different potential streams of income. Equity, being the higher risk form of financing, will tend to reward its owners with higher returns over long periods of time. Why equity outperforms credit is hotly debated, but it makes sense that equity outperforms because the return on financing via equity must be higher than the potential return an investor will earn on otherwise safe assets. That is, if I am an entrepreneur who can earn 5% from a low risk bond it does not make sense for me to invest my capital in an instrument or entity that might not generate a greater return. In this sense, equity generates greater returns than credit because it’s not worth the extra risk to issue equity if the alternative is a relatively safe form of credit. Of course, it doesn’t always play out like this in the short-term, but if you think of equity as a sufficiently long-term instrument then it will tend to be true over the long-term because it’s the only rational reason for equity to be issued in the first place.³ ¹ – As an advocate of diversified indexing I can rightly be included as a “dope” about both asset classes. ² – This return could actually be lower due to defaults, callability, etc. ³ – “Long-term” in this instance has been calculated as at least a 25 year duration for equity. This is a sufficiently long period during which we should expect to see equity consistently earn a risk premium over credit.

Can You Deal With A Stock Market Downturn?

Sometimes we’re late to interesting polls, but hey, they’re still interesting. Back in November, Gallup and Wells Fargo polled people to ask them how well they could stomach a “significant” market downturn, publishing the results on January 22nd . Or note, they defined significant as 5-10%. The results were quite confident: Gallup/Wells Fargo Downturn Poll Some wacky lines there – 87% of stockholders were at least moderately confident in their portfolios, and 82% of investors overall. People in a better position to actually handle downturns with smaller returns – those who don’t hold stocks – were only 61% moderately or better confident. Should We Trust Our Peers at their Word? In a word, no. These are interesting results, for sure, but I see lots of problems here – not just the fact that a significant downturn is defined as only 5-10%. The most recent recession saw drops an order of magnitude larger – in percentage terms (!) – of over 50% in major indices. We lost major financial institutions over a hundred years old, investors panicked, and maybe 10% of people (that’s a stretch) were confidently buying at any opportune time, let alone not panic-selling everything they owned. (We played around with what a “significant” drop might actually be in the past, but found you can be more than a few years early with your calls in some circumstances and still weather a downturn.) So let’s concentrate on our peers’ answers themselves. Do you really think this poll accurately reflects how people would react in a downturn? No, neither do I. You’ve got something of a Lake Wobegon effect going on here – you know, the “fictional” town where everyone was above average. In reality, stock markets have a tendency to over-correct – markets historically oscillate somewhere between ridiculously overpriced and a bargain (of course, identifying those periods is, perhaps, impossibly hard except in retrospect). That’s because previously confident people are selling into a downturn – “locking in losses” – and buying only when the stock market has come back “buying the highs!”. In fact, identifying actual investor results backs up those statements to a degree you’d almost think impossible. Dalbar releases studies on actual investor performance in the markets versus price (or dividend reinvested price) returns, and the results are crazily disconnected: through November 2015, in the order of earning 5.5% on S&P 500 funds in the last 20 years, versus stated returns around 9.85% . (We have a calculator so you can see dividend reinvested returns for the S&P 500 and the Dow Jones Industrial Average). Okay Smart Guy, What Then? For the average investor – and, Wobegon aside, we’re all probably closer to average than we tell ourselves – the best move is to set it and forget it. Consistently, when we do have market downturns, it turns out that many investors have actually overestimated their intestinal fortitude. For a typical person, the best move is to set your portfolio during market doldrums , with a mind to setting in up in such a way that you won’t mind too much if there is a massive move to either the upside or downside. As for re-balancing, it’s best if you go in with a plan, and openly rebalance at a standard time – and, if you can, avoid doing it that often. Believing in your portfolio is one thing, but investing during mania or a crash is no formula for a successful long-time plan. So, make the case. Would you be prepared for a significant downturn without selling most of your portfolio? Why, or why not?