Tag Archives: momentum

Value And Momentum In Sports Betting

By Jack Vogel As noted through our previous posts, we are big proponents of Value investing and Momentum investing strategies. We even highlight the best way to combine value and momentum . However, there is a new paper by Toby Moskowitz, titled “ Asset Pricing and Sports Betting ,” which examines how size, value and momentum affect sports betting contracts: I use sports betting markets as a laboratory to test behavioral theories of cross-sectional asset pricing anomalies. Two unique features of these markets provide a distinguishing test of behavioral theories: 1) the bets are completely idiosyncratic and therefore not confounded by rational theories; 2) the contracts have a known and short termination date where uncertainty is resolved that allows any mispricing to be detected. Analyzing more than a hundred thousand contracts spanning two decades across four major professional sports (NBA, NFL, MLB, and NHL), I find momentum and value effects that move betting prices from the open to the close of betting, that are then completely reversed by the game outcome. These findings are consistent with delayed overreaction theories of asset pricing. In addition, a novel implication of overreaction uncovered in sports betting markets is shown to also predict momentum and value returns in financial markets. Finally, momentum and value effects in betting markets appear smaller than in financial markets and are not large enough to overcome trading costs, limiting the ability to arbitrage them away. Some Interesting Points The figure below explains the different price movements which are studied in the paper: The results are hypothetical results and are NOT an indicator of future results and do NOT represent returns that any investor actually attained. Indexes are unmanaged, do not reflect management or trading fees, and one cannot invest directly in an index. Additional information regarding the construction of these results is available upon request. Here are the T-stats for the momentum betas in the figure below: (click to enlarge) The results are hypothetical results and are NOT an indicator of future results and do NOT represent returns that any investor actually attained. Indexes are unmanaged, do not reflect management or trading fees, and one cannot invest directly in an index. Additional information regarding the construction of these results is available upon request. Analysis from the paper: A consistent pattern emerges for the Spread and Over/under contracts in every sport, where the momentum betas exhibit a tent-like shape over the three horizons—near zero from open-to-end, significantly positive from open-to-close, and significantly negative from close-to-end, with the initial price movement from open-to-close related to momentum being fully reversed by the game outcome. The patterns for the Moneyline contracts exhibit the same tent-like shape, but are less pronounced, consistent with the Moneyline perhaps being less affected by “dumb” money and more dominated by “smart” money. Then the paper shows the T-stats for the value betas in the figure below: (click to enlarge) The results are hypothetical results and are NOT an indicator of future results and do NOT represent returns that any investor actually attained. Indexes are unmanaged, do not reflect management or trading fees, and one cannot invest directly in an index. Additional information regarding the construction of these results is available upon request. Analysis from the paper: A consistent pattern is evident from the plots: a value contract’s betting line declines between the open and close and then rebounds between the close and game end, reaching the same level it started at the open. These patterns are consistent with an overreaction story for value, where value contracts, which measure “cheapness”, continue to get cheaper between the open and the close, becoming too cheap and thus rebounding positively when the game ends. This picture is the mirror image of momentum, where value or cheapness is negatively related to past performance, and hence the pictures for momentum and value tell the same story. (Though, recall the measures for value and momentum were only mildly negatively correlated.) Conclusion from the paper: Examining momentum, value, and size characteristics of these contracts, analogous to those used to predict financial market security returns, I find that momentum exhibits significant predictability for returns, value exhibits significant but weaker predictability, and size exhibits no return predictability. The patterns of return predictability over the life of the betting contracts—from opening to closing prices to game outcomes—matches those from models of investor overreaction. The results suggest that at least part of the momentum and value patterns observed in capital markets could be related to similar investor behavior. The magnitude of return predictability in the sports betting market is about one-fifth that found in financial markets, where trading costs associated with sports betting contracts are too large to generate profitable trading strategies, possibly preventing arbitrage from eliminating the mispricing. Our Thoughts: An interesting paper, showing that Value and Momentum work within the sports betting market, but the cost of trading on the signals is too large for profitable trades. This is probably why the “house always wins.” It’s a good thing I watch countless hours of sports to form my own “expert” opinions! Original post
The Trouble With Momentum – And What To Do About It

Summary Growth stocks have outperformed value stocks in recent years, which is shining a spotlight on momentum. Unlike other investment factors, the momentum premium has been persistent since it was identified by financial academics in the 1990s. We believe that combining momentum with value and other factors within a multi-factor framework is a compelling way to address the challenge of tapping momentum profitably in a growth portfolio. It’s no secret that growth stocks have outperformed value stocks in recent years. For example, in the two years from September 1, 2013 to August 31, 2015, large cap growth stocks (as measured by the Russell 1000 Growth Index) returned 14.7% annualized vs. 9.6% annualized for value stocks (Russell 1000 Value Index). This pattern of outperformance has shone a spotlight on momentum , an investment factor that works particularly well in growth-stock investing. But making money by identifying growth stocks with momentum characteristics isn’t as easy as it sounds. In this column, I will explain why and briefly describe how Gerstein Fisher addresses some of the problems inherent in tilting a growth stock portfolio to momentum. Momentum: a Persistent Investment Factor First, let’s define what we mean by momentum. Momentum is the tendency for winning stocks (that is, stocks that have outperformed the market over the past three to 12 months) to keep winning and losing stocks to keep losing. First identified in papers co-authored in the early 1990s by Sheridan Titman, one of our Academic Partners, the momentum factor would seem to refute the weak form of the Efficient Market Hypothesis, which asserts that stock prices reflect all available information and that past price movements should be unrelated to future average returns. Momentum suggests that prior movements in price are in fact related to expected stock returns – that security prices essentially have memory, which students of statistics will recognize as serial correlation. Since those landmark studies in the 1990s, a number of other academic papers have established that a momentum strategy works not only in equity markets around the world (with the notable exception of Japan’s) but also in several other asset classes, including currencies and commodities. At Gerstein Fisher, we find that a momentum tilt works at least as well in our multi-factor real estate investment trust (aka REIT) portfolio as in our US and international growth equity strategies. Exhibit 1 shows the compound annualized returns from 1927 to 2014 for 10 portfolios formed on momentum (defined here as the one-year return skipping the most recent month). Investing in the highest past one-year return (i.e., highest-momentum) stocks generated a 16.9% annualized return, while the lowest decile of momentum lost 1.5% per year. Note the steady improvement in performance as momentum increases. (click to enlarge) Moreover, unlike some other investment factors identified by financial academics, momentum has remained remarkably robust and persistent. For instance, since the size premium for small cap stocks was identified in the early 1980s, it has shrunk dramatically (see my recent column for more on this phenomenon: ” Is the Small Cap Stock Premium Disappearing? “); similarly, the value premium has also sharply declined since Fama and French published their pioneering paper on it in 1992. Quite possibly, once seminal research is available in the public domain, quantitative investors target and thereby reduce the available premiums, although they still exist. But momentum seems to be different: our research shows that the strategy has remained profitable, generating a momentum premium of five to seven percentage points* even years after Prof. Titman’s groundbreaking papers in the 1990s. The Challenge for Momentum So if all of this academic and empirical evidence for momentum is present, then what’s the problem? For one thing, momentum stocks are also subject to short-term reversals, the tendency for stocks that have risen relative to the rest of the market in the last month to underperform those that have fallen relative to the rest of the market (for more on this topic, see our recently posted paper: ” Do past returns predict future returns? Evidence from Momentum and Short – Term Reversals “). In addition, the discipline and emotion-free decisions required to hold high-momentum winners and cut low-momentum losers every month are behaviorally difficult for many individual investors to make. Most importantly, there is a very large issue with turnover and transaction costs (and tax liabilities, if held in a taxable account) with a momentum growth stock portfolio. In short, without rules for controlling portfolio turnover, transaction costs will quickly devour a premium from a tilt to momentum (a monthly rebalanced, long-only momentum strategy may have a turnover of about 300%, implying a holding period of around four months). We believe that an effective approach to addressing the problem of excess turnover is by combining momentum, a so-called fast-moving factor, with value (which we may define, for instance, as a tilt to higher book-to-market stocks than the Russell 3000 Growth Index), a slow-moving factor. Combining these two negatively correlated factors in one portfolio provides factor diversification, which is a good thing since there are pronounced and different cycles to different factors. But we also find that by combining the signals of value and momentum, we can slow down portfolio trading dramatically and improve risk-adjusted performance, both relative to the index and compared to the sum of standalone value and momentum strategies-a typical advantage of a multi-factor strategy in one portfolio. We will soon publish our research on the optimum way to combine momentum and value in an academic journal. In the meantime, I invite you to read our working paper: ” Combining Value and Momentum “. Conclusion Growth stocks – and momentum – have been the source of strong performance in the stock market. The momentum premium is palpable but difficult to tap profitably in a growth portfolio. We believe that combining momentum with value and other factors within a multi-factor framework is a compelling way to address this challenge. *The momentum premium is defined as the returns of the highest 30% of large cap US stocks rated by momentum less the return of the lowest 30% of stocks rated by momentum. Data on momentum decile portfolios are taken from Ken French’s website. Disclosure: I/we have no positions in any stocks mentioned, and no plans to initiate any positions within the next 72 hours. (More…) I wrote this article myself, and it expresses my own opinions. I am not receiving compensation for it. I have no business relationship with any company whose stock is mentioned in this article.

Market Timing With Value And Momentum

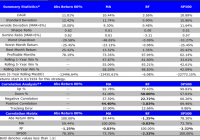
By Jack Vogel, Ph.D. Yesterday, we wrote a post showing a potential way to time the market using valuation-based signals. In the past, we have also examined how to use momentum-based signals (moving average rules and time-series momentum) to time the market. A natural question is, what happens when we combine the valuation-based signals with the momentum-based signals? Here at Alpha Architect, we are big believers in Value and Momentum . We have written about how to combine Value and Momentum in the security selection process here and here . In this post, we examine what happens when we combine valuation-based (value) signals with momentum-based (MA rule) signals. Here is the setup, from yesterday’s post: Strategy Background: We use 1/CAPE as the valuation metric, or the “earnings yield,” as a baseline indicator; however, we adjust the yield value for the realized year-over-year (yoy) inflation rate by subtracting the year-over-year inflation rate from the rate of 1/CAPE. To summarize, the metric looks as follows if the CAPE ratio is 20 and realized inflation (Inf) is 3%: Real Yield Spread Metric = (1/20)-3% = 2% Some details: The Bureau of Labor Statistics (BLS) publishes the CPI on a monthly basis since 1913; however, the data is one-month lagged (possibly longer). For example, the CPI for January won’t be released until February. So when we subtract the year-over-year inflation rate from the rate of 1/CAPE, we do 1-month lag to avoid look-ahead bias. We use the S&P 500 Total Return index as a buy-and-hold benchmark. So the two signals we will use are the following: Valuation-based signal: 80th Percentile Valuation-based asset allocation: Own the S&P 500 when valuation < 80th percentile, otherwise hold risk-free. In other word, if last month's CAPE valuation is in the 80 percentile or higher (data starting 1/1924), buy U.S. Treasury bills (Rf); otherwise stay in the market. Momentum-based signal: Long-term moving average rule on the S&P 500 (Own the S&P 500 if above the 12-month MA, risk-free if below the 12-month MA). The results are gross of any fees. All returns are total returns, and include the reinvestment of distributions (e.g., dividends). Indexes are unmanaged, do not reflect management or trading fees, and one cannot invest directly in an index. Our backtest period is from 1/1/1934 to 12/31/2014. Baseline Results: Here we show the results for 4 portfolios: Valuation-based market timing: Own the S&P 500 when valuation < 80th percentile, otherwise hold risk-free. Momentum-based market timing: Own the S&P 500 if above the 12-month MA, risk-free if below the 12-month MA. Risk-free: Total return to owning U.S. Treasury bills. SP500: Total return to the S&P 500. (click to enlarge) The results are hypothetical, are NOT an indicator of future results, and do NOT represent returns that any investor actually attained. Indexes are unmanaged, do not reflect management or trading fees, and one cannot invest directly in an index. Additional information regarding the construction of these results is available upon request. As previously noted, both Valuation and Momentum-based timing models increase Sharpe and Sortino ratios, while decreasing drawdowns. Now, let's combine them. Combining Value and Momentum Timing models: Here we show the results for 4 portfolios: (50/50) Abs 80%, MA : Each month, allocate 50% of capital to the valuation-based timing model and 50% or capital to the momentum-based allocation model. (and) Abs 80%, MA: Each month, examine the valuation and momentum-based signals. If both say "yes" to being in the market, invest in the S&P 500; if either or both say "no" to being in the market, invest in risk-free. (or) Abs 80%, MA: Each month, examine the valuation and momentum-based signals. If either says "yes" to being in the market, invest in the S&P 500; if both say "no" to being in the market, invest in risk-free. SP500: Total return to the S&P 500. (click to enlarge) The results are hypothetical, are NOT an indicator of future results, and do NOT represent returns that any investor actually attained. Indexes are unmanaged, do not reflect management or trading fees, and one cannot invest directly in an index. Additional information regarding the construction of these results is available upon request. Takeaways: Combining the Value and Momentum-based signals makes sense when using the "50/50 model" and the "(or) model." Both of these have higher Sharpe and Sortino ratios compared to standalone value and momentum-based models. The "(and) model" does not work very well - you are out of the market too often. Conclusion: Of course, transaction costs and taxes (not shown in the results above) need to be considered. However, it appears that combing Value and Momentum in market timing is promising, and something we will examine more carefully in the future. Original Post