‘The Turn’ Is Near For Natural Gas Pricing, Buy UGAZ
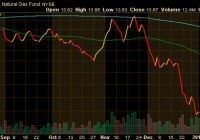
Summary UGAZ is about to bottom on Thursday despite a few poor inventories to follow. I lay the factors that will help lead natural gas pricing higher. Although plenty of volatility will follow, get long UGAZ and ride the longer term trend higher. “The Turn” for natural gas pricing, as I like to call it, should be taking place beginning with capitulation trading on next Thursday’s natural gas inventory report which should be a bloodbath for natural gas longs, of which I am as of a few days ago. 2014 was murderer’s row for natural gas bulls as natural gas couldn’t find a cold winter or anything resembling a winter outside of the occasional cold snap. Hilariously, for those like myself short the entire way down, that would cause an unwarranted and ill-advised #NotablePop (twitter hashtag searchable) buying of natural gas trading vehicles like The United States Natural Gas ETF, LP (NYSEARCA: UNG ) and even more hilariously the VelocityShares 3x Long Natural Gas ETN (NYSEARCA: UGAZ ). Take a look at these execution charts: (click to enlarge) (click to enlarge) (click to enlarge) Keep in mind that during the winter of 2013 UGAZ reached the high $40s. The ETN now trades in the $2s. I sold it to somebody at $45 (highlighted in the white box above), which frankly I still feel bad for the buyer. The good news is, I’ve switched hats from black to white and I’m now long a starter position of UGAZ at $2.90 with plenty of beaten and bloodied 2014 natural gas bull money to spend on lower buys. That can mean only one thing, natural gas pricing has bottomed and is about to go much higher. What’s my natural gas pricing increase thesis based around?: Falling rig counts hurt overall production – that’s good for the supply side of the equation as production is slowed overall. Less oil E&P to come on lower CAPEX across the board for oil and natural gas E&Ps – that’s also good for the supply side of the equation (Source: Bloomberg.com). I’m betting on the fact that spring will start early and Summer will be, well, it’ll be hot – that’s good for the demand side of the equation – for clarity these projections are based on longer term weather models from Weather.com which may be unreliable. I believe at poor hedging or at lower than ideal aggregate hedging that natural gas E&P names won’t “pump baby pump” as hard into what has been excellent hedging in size the last few years – that’s also good for the supply side. Examples of companies I’ve reviewed that have 1) less than ideal pricing hedging or 2) less than ideal aggregate hedging coverage are Chesapeake Energy Corporation (NYSE: CHK ) , Antero Resources Corporation (NYSE: AR ) , Ultra Petroleum Corp. (NYSE: UPL ) , H alcon Resources Corporation (NYSE: HK ) , SandRidge Energy, Inc. (NYSE: SD ), Quicksilver Resources Inc. (NYSE: KWK ), etc. This list could have been 50 names deep. Obviously the big variable portion of the equation above is weather. Let me do you guys a favor and make this real easy. Go ahead and pull up the city of Austin, TX into your weather app in your smart phone. Only view that city’s weather. Don’t EVER look at another city’s weather or another part of the country’s weather. Austin is the bell weather for natural gas demand. Why is that? I have no idea. Actually I think it has something to do with the fact that Austin is centrally-located, located near a major creator of weather systems – the equator, and that Texas in general is a huge user of natural gas. The fact that Austin sees the fewest of the far end of the spectrum weather developments when it comes to Texas cities makes it a great middle-spectrum city to judge Texas weather. Take a look at the following charts and consider the following: (click to enlarge) My models use a ground level temperature of 50 degrees as the demand generator for heating demand in the heating seasons and 75 degrees for cooling demand in cooling seasons. The redline in the graph on the left, which lists Austin temps the last twelve months, is indicative of this 50 degree temperature. Notice that when temps fall below the line (indicated by the blue streaking bars), UNG pricing moves higher. When it does not, UNG pricing moves lower. The correlations have been boxed in red . You can see a very high level of correlation between the two. Now, also notice that during the summer of 2014 there was in fact cooling demand (red lines on the chart to the left spiking above 80 degrees) but that demand was offset by greater than expected injections from natural gas producers (Source: U.S. Energy Information Administration) which held pricing flat through the summer and allowed for a further lack of cooling demand during the “winter” of 2014 (boxed in red toward the right hand side of each graph) to destroy natural gas pricing (also listed as a factor that will now contribute to the bull thesis as I believe from analysis of E&P sector names that hedging is not as comprehensive as it has been nor will production be as great because of the other factors bulleted). Notice that while the temperature curve remains the same from a slope line perspective the correlation falls apart in other regions – this is Chicago which stays in a much tighter temperature range: (click to enlarge) I’ve boxed Chicago temps in red below 50 degrees simply as a comparable temperature range but notice that Chicago temps stay in a 30 degree range basically year round with heating demand necessary just about 9 months out of the year. The correlation falls apart on this graph. How about New York City?: (click to enlarge) Again, we see the correlation fall apart. I have modeled in the correlation between UNG and every major city in the U.S. where demand is meaningful (based on population and the cities’ usage of natural gas) and Austin’s is the most reliable I could find. Again, with such tight temperature ranges it makes using other cities hard when trying to isolate a specific temperature at which demand is created and at which other weather systems will be effected. So, as I bid my short weapon of choice goodbye I’ll leave readers with a quick look at the chart that developed since I got long the VelocityShares 3x Inverse Natural Gas ETN (NYSEARCA: DGAZ ) at ~$2.75: (click to enlarge) If you haven’t already, I would begin accumulating a position in UGAZ on dips as I think the lowest it goes is ~$2.00 on Thursday’s smoke show. Even though several inventory reports in a row after that will be terrible, I think the big energy desks that trade this commodity will begin building positions that will start to support pricing. When you’re moving real weight, not the 100 share lots of retail, you have to do it over the course of a month or so and I think that starts in 6 days. For the record, I plan to run this column weekly or as often as I have a meaningful update to provide on inventory reports. That means you can tune in for tasty treats every Thursday. I have bought UGAZ but make no particular recommendation to any other person or entity to do so. Buying a 3X leveraged commodity trading vehicle should be done after one’s own analysis and at one’s risk. Disclosure The risks of investing in a 3X leveraged commodity trading vehicle like UGAZ/DGAZ are much greater than those of other vehicles. These risks include (Source: Velocitysharesetns.com/ugaz): ETNs are only suitable for knowledgeable investors seeking daily exposure (including inverse or leveraged exposure) to the underlying index. ETNs are intended for short-term trading, therefore investors with a horizon longer than one day trading should carefully consider whether the ETNs are appropriate for their investment portfolio. Because the inverse leveraged ETNs and leveraged long ETNs are linked to the daily performance of the applicable underlying Index and include either inverse and/or leveraged exposure, changes in the market price of the underlying futures will have a greater likelihood of causing such ETNs to be worth zero than if such ETNs were not linked to the inverse or leveraged return of the applicable underlying Index. The ETNs do not guarantee any return of principal at maturity and do not pay any interest during their term. At higher levels of volatility, and since the ETNs are not principal protected, there is a significant chance of a complete loss of ETN value even if the performance of the index is flat. The closing indicative value on each valuation date is determined in part by reference to the daily percentage change in the level of the underlying index. As a result, to the extent the closing indicative value of the ETNs is greater than or less than the initial indicative value, subsequent changes in the level of the index may have a bigger or smaller impact on the closing indicative value of the ETNs than if the closing indicative value remained constant at the initial indicative value. For example, assuming an initial indicative value of $100, if the closing indicative value of the ETNs increases above $100, a subsequent 1% daily change in the level of the index will result in more than a $1 decrease in the closing indicative value of the ETNs. Likewise, if the closing indicative value of the ETNs is less than $100, a 1% increase in the level of the index will result in less than a $1 increase in the closing indicative value of the ETNs. If the level of the underlying index decreases or does not increase sufficiently (or if it increases or does not decrease sufficiently in the case of the inverse ETNs), to offset the effect of the Daily Investor Fee over the term of the ETNs, the investor will receive less than the principal amount of his investment upon early redemption, acceleration or maturity of the Notes. This particular ETN also runs the risk of being decayed by contango which is defined by Investopedia as: A situation where the future price of a commodity is above the expected future spot price. Contango refers to a situation where the future spot price is below the current price, and people are willing to pay more for a commodity at some point in the future than the actual expected price of the commodity. This may be due to people’s desire to pay a premium to have the commodity in the future rather than paying the costs of storage and carry costs of buying the commodity today. Finally, there are general risks that should also be considered such as liquidity risk (Source: Investopedia.com): The risk stemming from the lack of marketability of an investment that cannot be bought or sold quickly enough to prevent or minimize a loss. Liquidity risk is typically reflected in unusually wide bid-ask spreads or large price movements (especially to the downside – which are magnified in leveraged ETNs) . The rule of thumb is that the smaller the size of the security or its issuer, the larger the liquidity risk. Disclosure: The author is long UGAZ. (More…) The author wrote this article themselves, and it expresses their own opinions. The author is not receiving compensation for it (other than from Seeking Alpha). The author has no business relationship with any company whose stock is mentioned in this article.

