Tag Archives: marketplace

Benchmarks May Have Their Uses But Gauging Portfolio Risk Is Not One Of Them

By Nick Kirrage Here on The Value Perspective, we have nothing against market indices in themselves but we do worry about how investors sometimes use them. Say you wanted to measure the relative returns on your investments over a suitably long time period, then please – benchmark away. But if you were planning to use an index as a way of gauging risk on your portfolio, here is why you should think again. People tend to see benchmarks as neutral entities and so, in some way, as an indication of safety – yet they are anything but. The classic example here – as so often – is the tech boom of the late 1990s. As technology stocks rose in value to become an ever greater part of market indices, so any ‘benchmark-aware’ funds had to buy more and more of the sector. As we know, this did not end well. Clearly, buying more tech in early 2000 as a means of reducing your risk relative to a benchmark index was a pretty flawed strategy but this is hardly a one-off example in the world of equities – or indeed in investment as a whole. In the fixed income sector, for example, index-relative global funds end up increasing their exposure to countries with the greatest amount of debt, regardless of the inherent risks. The reason we are revisiting the issue here is because of the recent decision by index provider MSCI not to include ‘A-Shares’ – those traded on China’s mainland stock exchanges of Shanghai and Shenzhen, as distinct from the ‘H-Shares’ traded on the Hong Kong exchange – within its principal global emerging markets benchmark. The last 18 months or so have seen an extraordinary bull run in Chinese equities and, while there have recently been some signs that has started to stall, China – by virtue of those H-Shares – now accounts for roughly 25% of the entire MSCI Global Emerging Markets Index. Had MSCI decided to include China’s A-Shares too, then that weighting would have jumped to around 45%. Presumably it is only a matter of time before MSCI deems all Chinese shares to be part of its emerging markets universe but, to our way of thinking, that is the rather farcical aspect of this debate – after all, regardless of whether MSCI or any other organizations reckons China to be an emerging market, it clearly is one. Where it becomes dangerous – and why we see MSCI’s decision as a near-miss (or perhaps a stay of execution) for benchmark-aware investors – is, the moment A-Shares are included in the index, these people will feel compelled to redirect yet larger quantities of money towards Chinese stocks because they apparently believe it would be a ‘risk’ to be so underweight China relative to their benchmark. But is that not perverse? It is not as if some huge new risk will have been revealed the day China’s weighting moves up from, say, 25% to 45%. Either it was always a risk to hold 25% in China or it was never one. The reality will not have changed, only some of the rules – but those rules can become hugely distorting. After all, if A-Shares had received the nod from MSCI and China now made up almost half the index, benchmark-aware investors would have had to scale back their exposures to other important emerging markets – for example, to 11% in Korea, 5.5% in Brazil and just 5% in India. This may not be quite as stark as our earlier tech boom example but it could have similarly unwanted consequences. Mind you, it could also throw up some similarly inviting possibilities for investors who prefer, as we do here on The Value Perspective, to think about risk in absolute as opposed to relative terms and for whom, in many ways, benchmark indices represent an opportunity more than they do a threat.
Backtesting With Synthetic And Resampled Market Histories

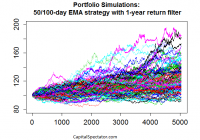
We’re all backtesters in some degree, but not all backtested strategies are created equal. One of the more common (and dangerous) mistakes is 1) backtesting a strategy based on the historical record; 2) documenting an encouraging performance record; and 3) assuming that you’re done. Rigorous testing, however, requires more. Why? Because relying on one sample-even if it’s a real-world record-doesn’t usually pass the smell test. What’s the problem? Your upbeat test results could be a random outcome. The future’s uncertain no matter how rigorous your research, but a Monte Carlo simulation is well suited for developing a higher level of confidence that a given strategy’s record isn’t a spurious byproduct of chance. This is a critical issue for short-term traders, of course, but it’s also relevant for portfolios with medium- and even long-term horizons. The increased focus on risk management in the wake of the 2008 financial crisis has convinced a broader segment of investors and financial advisors to embrace a variety of tactical overlays. In turn, it’s important to look beyond a single path in history. Research such as Meb Faber’s influential paper “A Quantitative Approach to Tactical Asset Allocation” and scores of like-minded studies have convinced former buy-and-holders to add relatively nimble risk-management overlays to the toolkit of portfolio management. The results may or may not be satisfactory, depending on any number of details. But to the extent that you’re looking to history for guidance, as you should, it’s essential to look beyond a single run of data in the art/science of deciding if a strategy is the genuine article. The problem, of course, is that the real-world history of markets and investment funds is limited-particularly with ETFs, most of which arrived within the past ten to 15 years. We can’t change this obstacle, but we can soften its capacity for misleading us by running alternative scenarios via Monte Carlo simulations. The results may or may not change your view of a particular strategy. But if the stakes are high, which is usually the case with portfolio management, why wouldn’t you go the extra mile? The major hazard of ignoring this facet of analysis leaves you vulnerable. At the very least, it’s valuable to have additional support for thinking that a given technique is the real deal. But sometimes, Monte Carlo simulations can avert a crisis by steering you away from a strategy that appears productive but in fact is anything but. As one simple example, imagine that you’re reviewing the merits of a 50-day/100-day moving average crossover strategy with a one-year rolling-return filter. This is a fairly basic set-up for monitoring risk and/or exploiting the momentum effect, and it’s shown encouraging results in some instances-applying it to the ten major US equity sectors, for instance. Let’s say that you’ve analyzed the strategy’s history via the SPDR sector ETFs and you like what you see. But here’s the problem: the ETFs have a relatively short history overall… not much more than 10 years’ worth of data. You could look to the underlying indexes for a longer run of history, but here too you’ll run up against a standard hitch: the results reflect a single run of history. Monte Carlo simulations offer a partial solution. Two applications I like to use: 1) resampling the existing history by way or reordering the sequence of returns; and 2) creating synthetic data sets with specific return and risk characteristics that approximate the real-world funds that will be used in the strategy. In both cases, I take the alternative risk/return histories and run the numbers through the Monte Carlo grinder. Using R to generate the analysis offers the opportunity to re-run tens of thousands of alternative histories. This is a powerful methodology for stress-testing a strategy. Granted, there are no guarantees, but deploying a Monte Carlo-based analysis in this way offers a deeper look at a strategy’s possible outcomes. It’s the equivalent of exploring how the strategy might have performed over hundreds of years during a spectrum of market conditions. As a quick example, let’s consider how a 10-asset portfolio stacks up in 100 runs based on normally distributed returns over a simulated 20-year period of daily results. If this was a true test, I’d generate tens of thousands of runs, but for now let’s keep it simple so that we have some pretty eye candy to look at to illustrate the concept. The chart below reflects 100 random results for a strategy over 5040 days (20 years) based on the following rules: go long when the 50-day exponential moving average (NYSEMKT: EMA ) is above the 100-day EMA and the trailing one-year return is positive. If either one of those conditions doesn’t apply, the position is neutral, in which case the previous buy or sell signal applies. If both conditions are negative (i.e., 50-day EMA below 100 day and one-year return is negative), then the position is sold and the assets are placed in cash, with zero return until a new buy signal is triggered. Note that each line reflects applying these rules to a 10-asset strategy and so we’re looking at one hundred different aggregated portfolio outcomes (all with starting values of 100). The initial results look encouraging, in part because the median return is moderately positive (+22%) over the sample period and the interquartile performance ranges from roughly +10% to +39%. The worst performance is a loss of a bit more than 7%. The question, of course, is how this compares with a relevant benchmark? Also, we could (and probably should) run the simulations with various non-normal distributions to consider how fat-tail risk influences the results. In fact, the testing outlined above is only the first step if this was a true analytical project. The larger point is that it’s practical and prudent to look beyond the historical record for testing strategies. The case for doing so is strong for both short-term trading tactics and longer-term investment strategies. Indeed, the ability to review the statistical equivalent of hundreds of years of market outcomes, as opposed to a decade or two, is a powerful tool. The one-sample run of history is an obvious starting point, but there’s no reason why it should have the last word.

When Should You Sell A Mutual Fund?

Lipper’s Jake Moeller examines some qualitative reasons to reconsider holding a mutual fund investment. Investors interested in this topic can also register to attend the Lipper UK Fund Selector & Fund of Funds Forum in London on July 14, 2015. As a former fund-of-funds manager, Lipper clients regularly ask me about sell triggers for mutual funds. This question is quite amorphous; there are many factors that could result in a fund no longer being “fit for purpose,” but that depends on how the fund is being used. When investors blend funds into a portfolio, they have different tolerances for a sell decision than when, for example, they hold a single fund in isolation. When I managed a guided-architecture platform from which I constructed a number of portfolios, I would often sell a fund out of my portfolios but still keep it on the guided-architecture platform. Such decisions are uniquely a factor of what fund selectors call “style bias.” A large-cap fund, for example, might underperform considerably in a sustained mid-cap rally, but that doesn’t mean it is a poorly managed fund. The following factors are some key reasons to consider letting a fund go: Fund manager departure Fund managers move house for myriad reasons: ambition, retirement, redundancy to name a few. If the departure is restricted to a single manager, this is generally a “hold and wait” situation. Many investors will follow the new fund manager, but a large fund house should have contingency protocols in place and the performance of the old fund shouldn’t necessarily head south. Where a fund house is very quiet about a key departure, there may be a legal covenant underpinning an unpalatable situation. A single fund manager departure can also signal the start of distracting team restructuring and destabilization. Respect the fund house that gets information out early. The less that is said, the stronger the sell signal. “Activeness” A fund manager who closely tracks an index may be doing so for perfectly legitimate reasons: a lack of conviction, a portfolio restructure, or staff changes can result in emergency indexing. It is the duration of this positioning that matters. An active equity fund manager’s maintaining an index position for over three months, for example, would certainly be a red flag. Marketing support Often overlooked in importance: when a fund house stops marketing a fund or has another flavour of the month, this can often be a bad sign. “Legacy” funds are often poorly managed, and with little inflow they potentially leave investors languishing at a disadvantage. The retrenchment of sales directors can often be another leading indicator that funds might switch to legacy footing or that they are expecting less supportive inflows into their business. Corporate activity A takeover, acquisition, or merger requires considerable analysis, but it can be reduced to a very fundamental issue: cultural compatibility. Not many strategic bond managers, for example, would take well to a new parent company’s investment committee favoring utilities at any cost “because that’s best for our balance sheet.” Capacity A fund that becomes too large to maintain a manageable number of securities in its portfolio is likely to become either an index hugger or to compromise the technical expertise of its manager. There are so many quality boutique funds in the market that there is no excuse for holding an active fund that has say 2,000 securities in it. Outflows Outflows in and of themselves are not always a concern. However, when they coincide with a falling share price (where the fund manager is listed) and poor performance, you have a pretty strong sell signal. You will want to get out before all the cabs have left the rank. Round peg, square hole Has your fund house recently appointed a head of U.K. equities for your U.S. portfolio? Fund management is a specialized task and is only rarely truly portable. An expertise in one area does not guarantee expertise in another. Such an appointment warrants critical review. Courage under fire If fund managers are underperforming when their style should be in favour, an investor needs to question the skill of the managers; most fund managers make bad calls in their career but restore faith by sticking to their guns. If poor stock selection results in a fund manager “tweaking” the process or compromising philosophies, this should act as a warning flag. Poor performance Differentiate symptom and cause. Poor performance needs to be understood, not reacted to blindly. Where poor performance is a result of style biases or out-of-favor portfolio selection, one may likely end up selling just as the fund turns around. Where poor performance coincides with any of the qualitative factors outlined above, it is unlikely to be coincidence. Furthermore, these factors may occur before performance starts to be affected. Such factors warrant serious consideration to saying adieu to a fund.