Tag Archives: market

Opportunities In Russia?

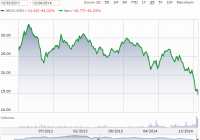
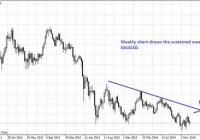
Russian companies may offer the best values in the world currently. Buying assets for pennies on the dollar. An excellent contrarian play is developing. “After an extremely strong performance by U.S. markets this year, it is our belief that emerging markets will be more in focus next year as investors rotate into underperforming areas. Of these markets, Russia, has the lowest fundamental valuation. With new positive light shining on President Vladimir Putin, after having negotiated a peaceful solution to Syria’s chemical weapons program, and the world watching the 2014 Winter Olympics in Sochi, Russia; we expect the government controls to loosen providing an economic boost on top of a general recovery in equity prices.” That was an excerpt taken from a letter I wrote to clients in November of last year, 2013. My timing was nearly perfect in choosing the precise opposite moment to go long Russian equities. The comments occurred at what would prove to be the high-water mark for the Russian equity markets to date. What seemed like unrelated developments in neighboring Ukraine would prove to be a harbinger for things to come. In December 2013 more than 800,000 protesters occupied Ukraine’s Kiev city hall and Independence Square in Ukraine. And by February 22nd, after months of violence and the resignation of Ukrainian Prime Minister Mykola Azarov, the government collapsed as protesters took control of presidential administrative buildings and President Yanukovych fled the country. Less than a week later “pro-Russian” gunmen responded to the collapse of the regime by seizing key buildings in the Crimean capital, Simferopol. On March 16th, Crimea seceded from Ukraine and two days later Russian President Vladimir Putin signed a bill absorbing Crimea into Russia. Since Crimea’s annexation, violent clashes between the new Ukrainian government and pro-Russian militants have continued along the Russian-Ukrainian border. Tensions between the European Union, along with the U.S., and Russia continued to mount as violence escalated. On July 30, 2014 the EU and U.S., along with other NATO nations, announced sanctions against Russia. Little progress toward a peaceful outcome has been made in the months since. The sanctions imposed in July were directed at Russia’s economy. Specifically against the financial sector and the majority government-owned Russian banks. Additional trade restrictions were aimed at the energy and defense industries along with individuals and entities whose overseas assets were frozen. Sanctions have continued to strengthen and have been adopted by additional countries around the world putting a severe strain on the Russian economy. Even before the sanctions, Russia’s perceived involvement in the fighting had already taken a toll on Russian equities as their markets fell by 25% by the spring of 2014, as seen here by the Market Vectors Russia ETF (NYSEARCA: RSX ): By autumn, the Russian real economy was showing the strains from the bite of sanctions. As if things could not have been getting any worse for Russian markets the price of oil had also begun a precipitous fall in June of this year and has not yet stopped even with the price of crude having been cut in half. While prices seem to have stabilized in the past couple of weeks it is still unclear as to whether or not that massive fall is now over or if we might still see more downside pressure. Just over half of Russia’s stock market capitalization is made up of oil and gas producers. As is always the case, oil producers have fallen in tandem with Brent Crude prices helping to push the overall Russian markets down an impressive 47% this year, making it the worst performer anywhere in 2014. As a result of oil’s depreciated price and the sanctions against their financial industry, the Russian Ruble has collapsed 70% against the U.S dollar putting even further pressure on the economy as the price of necessary imports become unaffordable. All of the above factors have pushed Russia into what is expected to be a deep recession next year. Data released by the Economy Ministry of Russia on December 29th showed the country’s GDP shrinking 0.5% in November. This was the first contraction since September 2009 during the global financial crisis and follows forecasts for GDP to fall as much as 4.7% in 2015 if oil prices remain at current levels. So the question now is whether or not all of this bad news has been priced into an already fundamentally ‘cheap’ market? Over the past 10 years Russian shares have traded at a discount to other emerging markets with an average Price-to-Earnings (P/E) ratio of 7.1. This discount reflects the country’s political risks as well as its dependence on the cyclical energy industry. While a discount is deserved, current valuations are reaching levels of absurdity. The U.S. based ETF RSX, whose stated goal is to “replicate as closely as possible, before fees and expenses, the price and yield performance of the Market Vectors Russia Index”, is the simplest way for U.S. investors to gain exposure to the overall Russian market. Currently the companies owned in the ETF portfolio have an average P/E of 6.55 and a Price-to-Book (P/B) ratio of 1.08. While certainly a discount to the country’s long term average it doesn’t exactly scream “bargain” at those valuations. A closer look at individual companies however yields a much different picture. Gazprom ( OTCQX:GZPFY ), the country’s largest company by market cap, currently trades at a P/E of 1.66 with a (P/B) ratio at 0.18. Sberbank ( OTCPK:SBRCY ), the country’s largest bank, trades at a P/E of 1.91 with a P/B at 0.35. OAO Tatneft ( OTCPK:OAOFY ), an oil and gas exploration company, trades at a P/E of 3.21 and P/B at 0.53 All of these companies are directly impacted by current and potential future sanctions, low oil prices, and the overall economic decline. They deserve to be trading at discounts to their foreign peers and historical averages. However, current valuations for these companies are absurdly low considering that they do have real value in their owned assets and their potential future earnings. When you can purchase $1.00 worth of assets for $0.18, as is the case with Gazprom based on their P/B ratio, or $0.35 and $0.53 on the dollar with Sberbenk and Tatneft respectively; I believe it to be a worthwhile endeavor to take a closer look at the potential opportunity. It is unlikely that all-out war will break out between NATO and Russia, as it would benefit no one. I also find it more likely that sanctions will begin to ease rather than tighten as the European Union is suffering economically from the imposed sanctions as well. It looks more and more likely that the EU will also fall into recession next year and I would expect them to start pushing back against any further sanctions suggested by the U.S. in an attempt to restore their own economies. It’s also important to remember that Europe is highly dependent on Russian energy exports for their own well-being and while finding replacement sources is not impossible it is substantially more expensive. While market participants’ sentiments may not have reached the point of maximum pessimism, and additional problems can certainly arise; at some point this market will bottom. Russia will continue to not only exist in the future but grow economically. An excellent contrarian play is developing. I wouldn’t attempt to call a bottom at current levels but when the situation does begin to improve, either through conciliatory actions by the Russian government leading to easing of sanctions or a price recovery in oil, or both, the market upside could be substantial for the brave few who take advantage at the right time.

Dallas Fed Fisher’s Prescience And GLD

Recent third quarter GDP growth of 5% at 11 years high brings credibility to Fisher’s bullish dissent which is unforeseen by the FOMC. This brings greater possibility of an earlier rate hike forward to the March or April 2015 meeting especially if it is reflected in the upcoming labor figure. GLD paused its decline in this quiet festive market. This is the time to go short GLD before the market resumes fully in the second week of 2015. Voting against the action were Richard W. Fisher, who believed that, while the Committee should be patient in beginning to normalize monetary policy, improvement in the U.S. economic performance since October has moved forward, further than the majority of the Committee envisions, the date when it will likely be appropriate to increase the federal funds rate.” The quote is extracted from the statement of the Federal Open Market Committee (FOMC) released on 17 December 2014 . Dallas Federal Reserve President Richard Fisher took on a more bullish stance than the rest of the committee. During the meeting, the FOMC took reference from the October 2014 economic data and came to a bullish stance where you can read on my previous article ‘ Dissents At The December 2014 FOMC Meeting Hints At Earlier Rate Hikes ‘. At that point, I was not very convinced about Fisher’s outlook as I believe were the case of the rest of the FOMC. The US were showing some strong number such as the November 2014 non farm payroll of 321,000 which is better than the previous reading of 243,000 and expectations of 231,000 and average hourly earnings increase of 0.4% over 0.1% in October and 0.2% of market expectations. However there were misses as well such as the 0.3% contraction of the consumer price index in November after no change in October. Flash manufacturing purchasing manager index came in lower at 53.7 in November compared to a 54.8 reading in October and market expectations of 56.1. However with the 23 December 2014 revision of the third quarter 2014 from 3.9% to 5.0% which is not seen in 11 years since the third quarter of 2003, I am beginning to think that Fisher might be prescient in his observation. The FOMC will meet again next month from 27 to 28 January 2015. They will observe that GDP grew by 5.0% in the third quarter of 2014, at a 11 year high and agree with Fisher’s observation. During Chair Janet Yellen’s latest press conference , she had the following projection about GDP growth: The central tendency of the projections for real GDP growth is 2.3 to 2.4 percent for 2014, up a bit from the September projections.” The fact that GDP grew at such a rapid rate should persuade the Fed to raise rates at an earlier date perhaps in the March or April meetings instead of the June meeting as widely expected in the market. This would be so especially if there is continued improvement in the labor market. Hence we should keep a lookout for 09 January 2015 figures for the non-farm payroll and unemployment rate data. During the same press conference, Yellen set an unemployment target of 5.2% to 5.3% in the quote below: The central tendency of the unemployment rate projections is slightly lower than in the September projections and now stands at 5.2 to 5.3 percent at the end of next year, in line with its estimated longer-run normal level.” However I don’t think that the FOMC would start rising rates when unemployment rate is at 5.2% -5.3%. Instead I am of the opinion that they would start to rise rates as unemployment start to move towards their target as GDP grows. This would obviously be bullish on the United States Dollars (USD) after the market returns from the holiday season on the second week of 2015. Then I turned my thoughts to gold. You might have heard of this argument in one form or another before but it is worth repeating. As the US rises interest rates, it will be more expensive to hold onto gold as it gives no return and in fact cost you in terms of insurance and storage if you were to hold physical gold. Of course, there is the theory that holding gold is an insurance against the economic collapse but this is getting less and less traction especially with GDP growth of 5%. Then there is the argument that gold is a hedge against inflation but inflation is low and even the Fed foresees 1.0% to 1.6% inflation for 2015 if you refer to Yellen’s press conference. However, today I am going to offer a slight twist to it. The USD has not responded much to the record 11 year high GDP reading. You can read about it in my article ‘ USD Asleep As Q3 2014 GDP Hits 11 Years High ‘. In normal trading day, we would have seen USD raise by at least 100 pips but today if you are reading it before the market returns from the holiday, you might be in a position to short gold at a good price as gold gains partial strength by default after sustained selling in the past week with a lesser possibility of being hit by a retracement. Even if you miss the chance to sell gold by the time you read it, you can also sell it but with a wider stop loss. You can take the daily volatility as a guide. (click to enlarge) (click to enlarge) The 2 charts above shows the weekly and daily chart of XAU/USD. XAU is the symbol for gold while USD represents United States Dollar which we are all familiar with. The weekly chart shows that this pair is under constant pressure even if there are periodic upticks. The current weekly chart looks like it is on the downtrend after completing its recent bounce to a high of $1238 two weeks back. The daily chart shows us that the XAU/USD is having one of its uptick but this is likely to be temporary. This is a function of the thin trading market during the festive season and traders can take this opportunity to sell and set their stop loss at $1230. Of course, there is no sure thing in trading and one should set the position size accordingly. For those who want to avoid the leverage inherent in forex, they should use the SPDR Gold Trust ETF (NYSEARCA: GLD ) instead. GLD is listed on the New York Stock Exchange and highly liquid with $26.90 billion of market capitalization and transaction volume of 1.5 million shares. (click to enlarge) The chart above shows the weakness of the GLD after the peak 2 weeks back which is an interim retracement. Now is the time to go short the GLD as it pauses before its downtrend and catch the trend before it slowly resumes again next week.

An ETF Leveraged Pairs Strategy That ‘Works’ (But Would Still Be A Terrible Investment)

Summary In general, shorting pairs of leveraged ETFs does not generate favourable returns. An exception to this is shorting the volatility future TVIX, XIV pair, with this giving seemingly excellent returns. But this strategy is not advised, with the investor effectively selling financial catastrophe insurance. The theory The core equation describing the expected return of a leveraged ETF is as follows: Here ‘underlying return’ is simply the return on the asset the ETF leverages, anything from SPY, industry-specific equity funds, VIX futures and various commodities. λ specifies the ETF’s leverage; typically this is -1 (i.e. inverse), 2 or sometimes 3. Finally, σ is the standard deviation of the underlying return. The equation can be split into two, showing the key drivers of the return: The return on the underlying, leveraged λ times: The decay from volatility: It is the second – volatility decay – term that generates much of the criticism of leveraged ETFs. It reduces the return unless the ETF is unlevered i.e. λ = 1 or has no volatility i.e. σ = 0. Its adverse impact increases with leverage and the volatility of the underlying. The practical reason for volatility decay is the ETF’s daily rebalancing: a, say, 10% fall in the underlying, followed by a 10% rise will leave the underlying unchanged but see a leveraged ETF lose money. A leveraged ETF’s return is, however, not necessarily negative. It depends on the balance between the underlying’s return and the volatility decay factor. For example, SPY – representing the S&P 500 – has a (conservative) expected return of, say, 6% p.a. and a standard deviation of, say, 20% p.a. Plugging these numbers into the above formula gives a long-run expected return of ~8% for a 2x leveraged SPY ETF. This is well below the naïve 2 x 6% = 12% expectation, but is an improvement on the unlevered 6%. It is nevertheless at the cost of more than proportionally increased volatility. The theory applied to shorting leveraged ETF pairs Moving on to this article’s main subject, shorting pairs of leveraged ETFs. Applying the equation to shorting a pair of ETFs with leverage λ and -λ: The next step needs some algebra. Take the above equation and expand out (using Taylor’s series), neglecting any term higher than order 2 (these terms will be small in comparison). Then with λ = 2: Examining this equation shows the return will be positive for realistic pairs of leveraged ETFs: an asset’s return standard deviation (σ) will be bigger than its expected return (U). By shorting a pair of ETFs with opposite leverage and the same underlying, the return of the underlying cancels out and does not impact the strategy’s result. The strategy instead collects the (on average) losses generated by the interaction of the asset’s volatility and the daily rebalancing. In practice: Shorting UPRO and SPXU These two ETFs are designed to give 3x and -3x the compounded daily return on the S&P 500. Shorting $100k of both gives the following return chart: …equating to a stable before cost return of ~2% p.a. Unfortunately, the after cost return is ~-5%! These costs are principally the cost of borrowing the shares to short. I have UPRO costing ~5% p.a. to borrow and SPXU ~3.5% p.a. Notwithstanding the theory above, the market is efficient and has reached such by increasing borrow costs to unusually high levels. Similar results occur for all – bar one – pairs of leveraged ETFs that I have examined. In practice: Shorting TVIX and XIV The exception are a couple of volatility ETFs, TVIX and XIV. TVIX is designed to return 2x the VIX futures short term index. XIV is designed to return -1x the same index. Because the fund’s leverages are not equal and opposite, this strategy involves shorting $2 of XIV for every $1 of TVIX. It results in the following return chart, for a $100k notional investment: After costs, it yields a return of ~10% p.a. with a Sharpe ratio of ~ 2 (compared to the S&P 500’s ~ 0.5). It is also possible to leverage this strategy further; as shown it starts at -$33k TVIX and -$67k XIV, but (if you have portfolio margin) your broker may allow multiples of these amounts. The strategy works because of the exceptionally high volatility of the underlying VIX futures, together with the ETF’s relatively large tracking errors. The large drawdown in early 2012 was caused by a short squeeze on TVIX. Its price rose well above its net asset value. The short squeeze occurred because the issuing bank reached its internal risk limits in respect of VIX futures. It hence stopped creating new TVIX units, removing the normal mechanism for keeping the ETF’s price near its net asset value. Holders of this strategy may well have had their TVIX shares called at the worst possible time – the minimum of the black curve – missing out on the subsequent recovery. The key problem with this strategy is, however, its tail risk. Gains from shorting a stock are limited to 100% of its value. Losses are unlimited. A large enough single-day increase in the value of VIX could see the strategy lose more than 100% of the notional investment. In particular, if a day sees the VIX short term futures index double or more, XIV – if it functions as designed – will go to zero. But TVIX can continue to rise, generating unhedged, potentially unlimited losses for the strategy. I suspect this is the main reason that the market allows this apparent inefficiency. Executing the strategy is equivalent to selling financial catastrophe insurance. Additional disclosure: I am sometimes long / short XIV, but do not execute this strategy.