Tag Archives: market

Cost-Efficient Exposure To Momentum

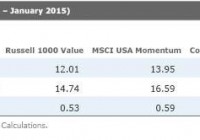
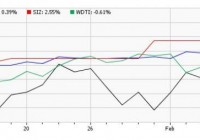
By Alex Bryan In many cases, extrapolating past performance into the future is a bad idea. In fact, securities that have outperformed for several years tend to become more expensive and priced to offer lower returns going forward. But in the short run, recent performance trends tend to persist. Winners over the past six to 12 months tend to continue to outperform for the next several months, while those that have underperformed often continue to lag. This phenomenon is known as momentum. It has been observed in nearly every market studied and across different asset classes over long periods. Investors can get efficient exposure to stocks with positive momentum through iShares MSCI USA Momentum Factor (NYSEARCA: MTUM ) for a low 0.15% expense ratio. This fund tracks an MSCI index that targets large- and mid-cap stocks with strong risk-adjusted price momentum, which differentiates it from traditional momentum strategies studied in the academic literature. This focus on risk-adjusted performance may help moderate the fund’s risk profile and reduce turnover. Volatility in a stock influences price movements, but this component of returns may not last. Risk-adjusted momentum gives a better signal of directional price movements, which may be more likely to persist. MSCI built the fund’s index with capacity in mind, at the expense of style purity. It usually only reconstitutes twice a year and applies a wide buffer to reduce turnover. On paper, momentum strategies appear to work better with reconstitution every month, as momentum is strongest over shorter windows. But in practice, monthly reconstitution can create high turnover and transaction costs. The index’s more tempered approach may improve its cost-efficiency, though it can still experience high turnover. In fiscal 2014, its turnover was as high as 123%. However, it has not yet distributed a capital gain, thanks to the exchange-traded fund structure, which allows managers to transfer holdings out of the portfolio through a nontaxable in-kind transaction with its authorized participants. Momentum is less likely to persist when volatility spikes. In order to address this potential problem, the fund’s benchmark applies conditional rebalancing in between the schedule reconstitution dates when market volatility significantly increases. When this rebalancing is triggered, the index focuses on more recent momentum to construct the portfolio. Investment Thesis In theory, investors should arbitrage any predictable price pattern away. Yet simple momentum strategies have historically worked (on paper) in nearly every market studied. Behavioral finance offers the best explanation for the momentum effect. Those in this camp assert that investors tend to anchor their beliefs and are slow to update their views in response to new information. For instance, event studies have demonstrated that stocks that beat earnings expectations have historically tended to offer excess returns for many weeks after the announcement. Similarly, stocks that miss expectations have tended to continue to underperform. Investors may also be reluctant to sell losers in the hope of breaking even and quick to sell winners in order to lock in gains. This irrational behavior may prevent stocks from quickly adjusting to new information. Once a trend is established, investors may pile on a trade or over-extrapolate recent results, pushing prices away from their fair values, which may contribute to the long-term reversals underlying the value effect (the tendency for stocks trading at low valuations to outperform). While momentum strategies have a good long-term record, they may struggle during periods of high volatility or market reversals. As a result, the fund can underperform when it is most painful. For instance, its benchmark lagged the MSCI USA Index by 3.8% during 2008. Heading into a bear market, momentum strategies tend to overweight riskier stocks, which may underperform during a correction. After a market downturn they tend to load up on defensive stocks, and they may miss out on some of the upside during a sharp recovery. There is also a risk that momentum may become less profitable as more investors attempt to take advantage of it. That said, the momentum effect hasn’t gone away even though it was first published in academic literature in 1993. Like any strategy, momentum can underperform for years. This risk may limit arbitrage and allow momentum to persist. MTUM’s moderate style tilt takes some juice out of the strategy. However, it still captures the essence of the style and at a lower cost than if it pursued a more aggressive rebalancing approach. It has a good chance of beating the market if momentum continues to pay off. But even if momentum doesn’t pan out, the fund’s low expense ratio doesn’t hurt performance much. This is a compelling holding on its own, but it can also offer good diversification benefits to value-oriented investors. That’s because momentum tends to work well when value doesn’t, and vice versa. Therefore, putting them together may reduce the risk of significantly underperforming, as the chart below illustrates. It shows the aggregate wealth accumulated in the MSCI USA Momentum Index, the Russell 1000 Value Index, and a portfolio split evenly between the two, divided by the wealth accumulated in the broad MSCI USA Index. When the line is sloping up, the strategy is beating the market, when it is sloping down, the strategy it is underperforming. Keep in mind that the MSCI USA Momentum Index’s live performance record only started in 2013. Sources: Morningstar Direct, Analyst Calculations. Portfolio Construction MTUM tracks the MSCI USA Momentum Index, which draws stocks from the market-cap-weighted MSCI USA Index, which includes large- and mid-cap stocks. In May and November, MSCI calculates the ratio of each stock’s price returns of the past 13 and seven months (excluding the most recent month to take into account the tendency for performance to reverse during that horizon) to its volatility during the past three years. There isn’t a great theoretical reason to use price returns rather than total returns, but it shouldn’t make a big difference. The index averages these two scores and selects the highest-scoring stocks until it reaches a fixed target number of stocks (currently 122). In order to reduce turnover, new constituents must rank in the top half of the index’s target number of securities to get priority over stocks that were previously in the index. Stocks already in the index only have to rank within 1.5 times the target number of securities to remain in the index. Holdings are weighted according to both the strength of their risk-adjusted momentum and their market capitalization, subject to a 5% cap. In addition to the scheduled semiannual reconstitution, MSCI may rebalance the index when the month-over-month change in the trailing three-month volatility of the market is larger than the 95th percentile of such monthly changes historically. When this occurs, the index only uses each stock’s seven-month risk-adjusted momentum score. Alternatives AQR offers some of the purest momentum funds on the market. However, these funds are only available in a mutual fund format, which can make them less tax-efficient. AQR Large Cap Momentum (MUTF: AMOMX ) (0.49%) ranks the largest 1,000 U.S. stocks by total return over the prior 12 months, excluding the most recent month, and targets the third with the strongest momentum. It weights its holdings according to both the strength of their momentum and market capitalization and rebalances monthly with an adjustment to reduce turnover. While AQR Large Cap Momentum’s $5 million minimum investment may seem a little steep, there is no minimum investment for investors who gain access to the fund through a financial advisor. AQR International Momentum (MUTF: AIMOX ) (0.65% expense ratio) and AQR Small Cap Momentum (MUTF: ASMOX ) (0.65% expense ratio) might also be worth considering. PowerShares DWA Momentum ETF (NYSEARCA: PDP ) is another option, but it is difficult to justify its 0.65% expense ratio. It targets stocks with the best relative strength and rebalances its portfolio quarterly. Historically, PDP has been less sensitive to the standard momentum factor documented in the academic literature than MTUM. Disclosure: Morningstar, Inc. licenses its indexes to institutions for a variety of reasons, including the creation of investment products and the benchmarking of existing products. When licensing indexes for the creation or benchmarking of investment products, Morningstar receives fees that are mainly based on fund assets under management. As of Sept. 30, 2012, AlphaPro Management, BlackRock Asset Management, First Asset, First Trust, Invesco, Merrill Lynch, Northern Trust, Nuveen, and Van Eck license one or more Morningstar indexes for this purpose. These investment products are not sponsored, issued, marketed, or sold by Morningstar. Morningstar does not make any representation regarding the advisability of investing in any investment product based on or benchmarked against a Morningstar index.

3 Under-The-Radar ETF Breakout Contenders

Summary With the market trading in a wide range since the beginning of the year, many momentum investors may be searching for signs of life in alternative areas. Several ETFs are showing positive technical divergences or signs of breakout that may warrant closer scrutiny. Solar stocks, consumer discretionary, and mid-cap stocks are excellent contenders. With the SPDR S&P 500 ETF (NYSEARCA: SPY ) trading in a wide range since the beginning of the year, many momentum investors may be searching for signs of life in alternative areas of the market. Just because the broad measure of U.S. stocks is waffling sideways, doesn’t mean that there aren’t suitable ETF candidates to add to your watch list at this juncture. The following funds are just a few of the ETFs I have been monitoring over the past several weeks as they show positive technical divergences from their peers. Guggenheim Solar ETF (NYSEARCA: TAN ) Solar stocks had a horrific year in 2014 that included various whipsaws and other erratic price action. They finished the year markedly lower despite positive net strength in large-cap indices such as SPY. However, they may be looking to turn those fortunes around in 2015 and have been showing a bias towards higher prices since bottoming in January. TAN is the largest renewable energy ETF with over $300 million in total assets. This fund tracks 29 global solar energy companies engaged in the manufacture, installation, and maintenance of solar power equipment. The index is composed of 47% U.S.-based companies, with the remaining allocation spread amongst China, Hong Kong, and other smaller nations. As you can see on the chart below, TAN had some brief consolidation at its 50-day moving average and is now marching back towards its long-term 200-day moving average. Since the beginning of the year, this ETF has gained more than 9% and is continuing to show positive relative strength versus many sector alternatives. Aggressive growth investors who can stomach heightened volatility may want to research solar ETFs as a possible comeback story for 2015. Consumer Discretionary Select Sector SPDR (NYSEARCA: XLY ) Consumer discretionary stocks are another area of the market that has shown strong momentum through earnings season. XLY is heavily dominated by media, specialty retail, and other luxury goods sellers such as Walt Disney (NYSE: DIS ) and Home Depot (NYSE: HD ). This ETF contains 87 large-cap stocks and charges an expense ratio of 0.15%. The strong vote of confidence for this sector came when it recently broke out above its 2014 highs and is continuing to show impressive overall strength. Many investors consider this ETF to be an indicator of consumer health, and judging by the price action, the trend of consumer spending habits continues in earnest. XLY will certainly be an important sector of the market to watch as a potential growth-focused momentum trade in 2015. iShares Core S&P Mid-Cap ETF (NYSEARCA: IJH ) Mid-cap stocks are another area of the market, similar to XLY, which has newly peeked out above its 2014 highs. IJH is the largest ETF in this space that tracks 400 mid-sized companies with market capitalization between $1.5 billion and $5 billion. This fund has over $24 billion in total assets and charges a modest expense ratio of 0.12%. While mid-cap stocks don’t always get as much recognition as their large or small-cap peers, they do have the potential to be successful long-term growth candidates. The positive technical move in this space should be viewed as a sign of building momentum that may lead to outperformance versus SPY in 2015. For my growth clients, I am accessing the mid-cap space through the Vanguard Mid-Cap ETF (NYSEARCA: VO ). This passive index follows a similar basket of 375 stocks and includes a lower expense ratio at 0.09%. The Bottom Line These growth themes show promising characteristics of momentum and strength versus plain-vanilla ETF alternatives. However, any new entrants in these ETFs should implement a stop loss or sell discipline to define your risk management strategy. In addition, when starting a new position, I typically recommend breaking up the trade in pieces so that you can add slowly over a limited time. This allows you to better control your cost basis and allocation size. Disclosure: The author is long VO. (More…) The author wrote this article themselves, and it expresses their own opinions. The author is not receiving compensation for it. The author has no business relationship with any company whose stock is mentioned in this article. Additional disclosure: David Fabian, FMD Capital Management, and/or clients may hold positions in the ETFs and mutual funds mentioned above. The commentary does not constitute individualized investment advice. The opinions offered herein are not personalized recommendations to buy, sell, or hold securities.

3 Low Beta ETFs For A Choppy Market

The U.S. stock market is caught in a web of uncertainty since the start of this year and sees little chance of it clearing up in the months ahead. This is primarily thanks to geopolitical tensions, sliding oil prices, turmoil in Greece, sluggish European and Japanese growth, weakness in key emerging markets, and weak corporate earnings. Additionally, the currency war has escalated with many countries choosing loose monetary policies to stimulate growth and prevent deflationary pressure. This is in contrast to the U.S. Fed policy of tightening the stimulus. The diverging central bank policies have propelled the U.S. dollar against the basket of various currencies to multi-year highs. Further, both the World Bank and International Monetary Fund (IMF) recently cut their growth forecast for the next two years. The World Bank projects the global economy to expand 3% this year and 3.3% in the next, down from 3.4% and 3.5%, respectively. On the other hand, IMF lowered its global growth outlook to 3.5% from 3.8% for 2015, representing the sharpest cut in three years. Growth for 2016 is forecast at 3.7% versus the previous projection of 4%. Another reason for the recent market pullback has been the U.S. monetary policy, wherein the Fed is on track to raise interest rates but the timing is still uncertain. Amid these uncertainties, investors are seeking exposure to alternative sources of income rather than equity and bonds. For these investors, an allocation to low beta funds could be the safest bet, as long as the disorder lingers. Why Low Beta? Beta measures the price volatility of the stocks or funds relative to the overall market. It has a direct relationship to the market movements. A beta of 1 indicates that the price of the stock or fund tends to move with the broader market. A beta of more than 1 indicates that the price tends to move higher than the broader market and is extremely volatile while a beta of less than 1 indicates that the price of the stock or fund is less volatile than the market. With that being said, low beta ETFs exhibit greater levels of stability than their market sensitive counterparts and will usually lose less when the market is crumbling. Though these have lesser risks and lower returns, the funds are considered safe and resilient amid uncertainty. However, when markets soar, these low beta funds experience lesser gains than the broader market counterparts and thus, lag their peers. Given the huge levels of volatility in the market, investors could find the following ETFs as intriguing options until the market track becomes clear. WisdomTree Managed Futures Strategy ETF (NYSEARCA: WDTI ): Beta – 0.02 This actively managed fund seeks to deliver positive returns in rising or falling markets that are uncorrelated to equity or fixed income returns. It uses a quantitative, rules-based strategy to provide returns that correspond to the performance of the Diversified Trends Indicator and invests in a combination of U.S. treasury futures, currency futures, commodity futures, commodity swaps, U.S. government and money market securities. This strategy seeks to benefit from both rising or declining price trends via long and short positions in commodity, currency, and U.S. treasury futures market. The product has amassed $209.9 million in asset base and trades in a light volume of about 34,000 shares a day. Expense ratio came in at 0.95%. The fund has added 0.3% so far in the year. QuantShares U.S. Market Neutral Size ETF (NYSEARCA: SIZ ): Beta – 0.14 This fund invests in low capitalization securities while at the same time short high capitalization stocks of approximately equal dollar amounts within each sector. It seeks to deliver the spread return between high and low ranked stocks. This can easily be done by tracking the Dow Jones U.S. Thematic Market Neutral Size Index. The product holds a long position in 200 stocks and a short position in another basket of 201 stocks. It will generate positive returns when the basket of long stocks outperforms the short portfolio. The fund is expensive charging 1.49% in fees per year and trades in a paltry volume of under 1,000 shares per day. BTAL is unpopular having AUM of $1.2 million and has added 0.9% so far this year. IQ Hedge Market Neutral ETF (NYSEARCA: QMN ): Beta – 0.19 This product tracks the IQ Hedge Market Neutral Index, which seeks to replicate the risk-adjusted return characteristics of hedge funds using a market neutral hedge fund strategy. It invests in both long and short positions in asset classes while minimizing exposure to systematic risk. This strategy seeks to have a zero beta exposure to one or more systematic risk factors including the overall market (as represented by the S&P 500 Index), economic sectors or industries, market cap, region and country. The portfolio consists of a variety of ETFs including a number of fixed income funds and equity funds. The ETF allocates heavy weights in fixed income products like the Vanguard Short-Term Bond ETF (NYSEARCA: BSV ), the iShares 1-3 Year Treasury Bond ETF (NYSEARCA: SHY ) and the Vanguard Total Bond Market ETF (NYSEARCA: BND ) focusing on Treasury and corporate securities that are of high quality. The ETF is often overlooked by investors in the hedge fund space with AUM of just $15.3 million and average daily volume of about 3.000 shares. It charges 85 bps in fees and expenses and is up 0.2% in the year-to-date timeframe. Bottom Line These products could be worthwhile for low risk tolerance investors and have the potential to outperform the broad market, especially if market uncertainty persists over the coming months.