Tag Archives: market

Value And Momentum: A Beautiful Combination

Asset allocation should be a dynamic process. Value-based asset allocation can serve as a long-term investment guide. Momentum can potentially add value by allowing tactical shifts. In our most recent articles, Diversification Is Not Sufficient and Value Based Asset Allocation , we documented two simple strategies for asset allocation. The strategies are based on two seemingly opposed factors, value and momentum. We illustrated in each article the historical results of following each strategy. Empirically, each demonstrated superior results to a static allocation approach. This article illustrates the benefits of combining the two strategies. The value-based asset allocation system (Value Allocator) is a robust enough system on its own to help you navigate the uncertain markets and avoid getting caught in the next crash. The problem is that the system is most likely behaviorally impossible to apply. Using momentum to complement the strategy is an important enhancement that provides participation in further growth and protection in the down markets. The momentum strategy appears to deliver the best results historically. However, we did not examine the impact of transaction costs (most likely negligible) and taxes (significant). We have no way to estimate the tax ramifications of any system as it is obviously only successfully analyzed at the individual level. The momentum-based strategy, because of the short-term gains, is most likely the least tax efficient. Momentum strategies are also difficult to follow year in and year out. Momentum trading does not always resemble the overall stock market. In fact, these types of strategies often look much different from the traditional stock indices like the Dow Jones Industrial or the S&P 500. Since the bottom in 2009, the Barclays CTA Index (a common benchmark for trend following) has been down in every year except for 2010 and 2014. The stock market has not had a negative year since 2008. Again, momentum strategies in isolation are extremely difficult to follow over a long period. In efforts to remain pragmatic, we have combined the value based strategy and a simple momentum strategy to provide a comprehensive asset-allocation system. From this point forward, we will reference the Value Allocator as the strategic component of our asset allocation, and the momentum strategy as our tactical overlay. The combination of the two strategies keeps an investor from moving the entire policy portfolio tactically and keeps a portion in a passive, strategic posture. The strategic component is based on the assumption that markets revert to the average. The problem is that mean reversion occurs over a period of seven to ten years. Valuations tell us very little about what is going to happen over the subsequent one to three years. Our strategic asset allocation process is based on long-term value and contrarian positioning. Tactical asset allocation is the process of taking positions in various investments based on short to intermediate term opportunities. Our tactical overlay is therefore based on reacting to the trend. This is an interesting relationship as the two strategies can offer up diametrically opposed recommendations. For instance, when the US stock market is overvalued, the Value Allocator would recommend rotating to a more conservative portfolio. At the same time, if the trend was positive but the market still overvalued, the tactical overlay would recommend overweighting. You can see the conflicts that can arise, and we assure you they have surfaced in the past. The Value Allocator-as illustrated in Value Based Asset Allocation -can rotate between 30 percent stocks and 70 percent bonds and 70 percent stocks and 30 percent bonds. The tactical portfolio is either 100 percent in stocks or 100 percent in the US 10-year Treasury bonds. The following matrix embodies all possible allocations when the two strategies are combined in equal proportions: Undervalued Market Overvalued Market Positive Trend 85% stocks /15% bonds 65% stocks/35% bonds Negative Trend 35% stocks /65% bonds 15% stocks /85% bonds The investor can have as little as 15 percent in stocks and as much as 85 percent. The wide range allows the investor to adapt to all market conditions, protecting when the odds are poor and growing when the odds favor return enhancement. Instead of fixing the allocation on a static portfolio, investors are allowed the flexibility to adapt their risk tolerance to the current environment. For instance, if the current market environment is undervalued, and the trend is positive, the environment is favorable for stocks. Thus, the investor would be positioned heavily in that asset class. (click to enlarge) The combination of the Value Allocator and momentum strategy outpaced the S&P 500 and fifty-fifty (stocks-bonds) benchmarks by a large degree. The advantage of the combination of these two strategies is quite clear. The worst loss the combination strategy experienced from 1972 to 2014 was 9 percent in 1974 when the market was down almost 26 percent. The Value Allocator, when analyzed in isolation, was down almost 18 percent during that same year. The momentum system added an extra layer of protection when the Value Allocator arrived early to the party. In addition to providing an extra layer of protection, the combination strategy provided growth that would have otherwise been missed during the late 1990s and from 2003 to 2007. The market stayed overvalued from 1990 until the beginning of 2009. If you had followed the Value Allocator during this period, you would have been disappointed. The combination strategy would have minimized the underperformance to the benchmark by keeping you at a higher equity position throughout the 1990s. In the chart depicted below, you can see the market outperform the combination strategy over this period. (click to enlarge) The market outperformance was only temporary, however, as the 50 percent decline from the peak in 2000 was largely avoided. In addition, instead of keeping the allocation conservative from 2003 to 2007, tactical positioning kept investors engaged in the markets. Following the Value Allocator alone from 2003 to 2007 would have had the investors conservatively positioned in 30 percent stocks and 70 percent bonds-largely missing the rebound from the tech wreck. The tactical component of the portfolio would have allowed investors to maintain 65 percent in stocks when the trend was positive, despite the overvalued conditions of the market. Astute investors would most likely diversify their strategic asset allocation with tactical positions. Value and momentum are two of the strongest factors of market returns, and their significance remains rather stable over time. Combining both value and momentum strategies in a disciplined fashion can create desirable investment results. Disclosure: I/we have no positions in any stocks mentioned, and no plans to initiate any positions within the next 72 hours. (More…) I wrote this article myself, and it expresses my own opinions. I am not receiving compensation for it. I have no business relationship with any company whose stock is mentioned in this article. Additional disclosure: HYPOTHETICAL PERFORMANCE RESULTS HAVE MANY INHERENT LIMITATIONS. NO REPRESENTATION IS BEING MADE THAT ANY ACCOUNT WILL OR IS LIKELY TO ACHIEVE PROFITS OR LOSSES SIMILAR TO THOSE SHOWN. IN FACT, THERE ARE FREQUENTLY SHARP DIFFERENCES BETWEEN HYPOTHETICAL PERFORMANCE RESULTS AND THE ACTUAL RESULTS SUBSEQUENTLY ACHIEVED BY ANY PARTICULAR TRADING PROGRAM. PAST RESULTS DO NOT GUARANTEE FUTURE RETURNS. HYPOTHETICAL PERFORMANCE FOR ILLUSTRATION PURPOSES ONLY.
Hold Off On VXUP And VXDN For Now

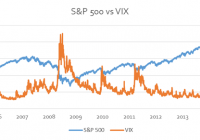
Summary VXUP and VXDN do not provide the “spot” VIX exposure as promised. VXUP and VXDN have had consistently high tracking errors. Distributions are not necessarily in cash and may be in the form of the opposing share. Volatility Products and VIX Exposure A variety of products have been developed over the years to mimic the performance of the VIX implied volatility index as well as possible. There are 3 distinct types of product available on VIX: VIX Futures – This provides indirect exposure to the movements in the index. There is a term structure in the VIX futures market. It is typically in contango. The implication of this is that long contract investors are paying a premium to contract sellers for portfolio insurance. The term structure will switch to backwardation when there are market sell-offs because VIX is mean reverting; this means that the VIX will drop and investors need to be compensated for the expected drop in the form of lower prices. It is important to note that the term structure will not be flat – this is akin to free insurance, and we all know there ain’t no such thing as a free lunch. VIX Options – This variety of call option performs excellent as portfolio insurance, because they capture the positive upside and are capped on the downside. It is likely that the option premium should reflect this, however, they are relatively illiquid. VIX-derived Exchange Traded Products – Products such as the iPath S&P 500 VIX Short-Term Futures ETN ( VXX) are ETFs based on VIX futures and therefore seek to mimic the futures market results. They are suitable for investors who are prevented by their mandates to invest in derivative products. However, it is worth noting that the significant issue with these products is that they necessarily lose out due to roll yield. A negative roll yield plagues markets in contango, where near futures are cheaper than further futures. The VIX futures market is generally in contango. These products should be held for short-term, tactical trades. Realized vs. Implied Volatility There is a significant body of literature on the subject and linkages between realized and implied volatility. Realized volatility is the actual average annualized volatility which occurred over a certain period. Implied volatility is the volatility that market expects to occur over a time period. Historically, implied volatility overestimates subsequent realized volatility. The implication is that there is a “volatility risk premium” in the options market – participants selling put options demanding more than fair value for the risk of providing portfolio insurance. What is the link between this and VIX? VIX is calculated from a wide range of option prices; it represents the market’s broad estimate of implied volatility. Thus, it also represents the market’s expectation of future volatility. This is why it is used as the “market fear gauge”. The value of VIX is driven most heavily by at-the-money put options on the S&P 500 Index. S&P 500 put options are a very simple manner in which to obtain portfolio insurance. One purchases the put option at the current level; if that market falls below that level, your portfolio drops as well, but you profit from the put option. Now, sellers of these options are effectively providing insurance to investors. How has volatility behaved over the last decade or so? The weeks where there were market drops of between 5% and 10% are tabulated below: Week Return VIX Performance 26 February 2007 – 5 March 2007 -5.19% 76.05% 8 August 2007 – 15 August 2007 -6.06% 42.98% 31 December 2007 – 8 January 2008 -5.32% 13.02% 14 January 2008 – 22 January 2008 -7.47% 35.41% 10 September 2008 – 17 September 2008 -6.14% 47.72% 22 September 2008 – 29 September 2008 -8.34% 38.02% 16 December 2008 – 23 December 2008 -5.48% -14.03% * 8 January 2009 – 15 January 2009 -7.25% 19.83% 27 February 2009 – 6 March 2009 -7.03% 6.43% 19 January 2010 – 26 January 2010 -5.05% 39.65% 30 April 2010 – 7 May 2010 -6.39% 85.71% 17 May 2010 – 24 May 2010 -5.57% 24.25% 25 June 2010 – 2 July 2010 -5.03% 5.57% 26 July 2011 – 2 August 2011 -5.85% 22.54% 15 August 2011 – 22 August 2011 -6.70% 33.17% 16 September 2011 – 23 September 2011 -6.54% 33.15% 26 September 2011 – 3 October 2011 -5.48% 16.48% 16 November 2011 – 23 November 2011 -6.07% 1.40% 8 October 2014 – 15 October 2014 -5.40% 73.73% *This is an outlier – VIX was coming off of its historical high. It has a mean reversion property. We can see that, for our narrowed down dataset, we can generally associate large VIX returns with relatively large market corrections. There is, however, no increasing/linear relationship here. This is probably due to mean-reversion property of the VIX itself. AccuShares VXUP and VXDN Recently released, the AccuShares Spot CBOE VIX Up Shares ETF ( VXUP) and the AccuShares Spot CBOE VIX Down Class Shares ETF ( VXDN) products seek to provide investors with a 1-month exposure to the pure VIX index. This is difficult because one cannot own a unit of volatility. Indeed, attempting to replicate the VIX index is a complex and costly exercise. How Does It Work? The total fund is effectively split into two separate funds that mirror one another. The “Up” and the “Down” fund. The assets in the fund are not related to volatility and are based entirely on U.S. treasury securities. The manner in which they achieve spot exposure is by simply offsetting the Up and Down shares against each other. Thus, the two move in the completely opposite direction. This means that they have created a zero-sum game and cannot lose. Only the investors can lose. If the VIX Index value is 30 or below as of a distribution date (which is basically a reset date) then a Daily Amount of 0.15% is subtracted from the Up fund and accrued to the Down fund. This works out to 4.5% monthly decay on being long volatility. You can think of this as a negative roll yield you would incur in the futures market. There are a variety of distributions which are paid to the investor and form the return. Regular Distribution – The intrinsic value of the Up and Down share match the percentage move of the VIX index over the 16th to 15th of every monthly cycle. Now, whichever fund wins, gets a distribution equal to the difference between its final value and the losing funds value. Then, the intrinsic value for both funds is set at the value of the losing fund. So the investor loses in capital gains what he gains over and above his return. The analysis of tax implications is a separate discussion. Special Distribution – The maximum gain in any month is capped at 90% to protect Down share investors from losing their entire investment. If any gains more than 75%, then there is a special distribution, which is simply an immediate distribution with the same rules as the regular distribution. Corrective Distribution – This occurs when the tracking error between intrinsic value and the market price is greater than 10% for 3 consecutive trading days. What happens is that the fund issues the equivalent number of the opposite shares to all investors, effectively resetting the fund values. For instance, say an investor hold 2 Down shares. After the corrective distribution, they will hold 2 Down shares and 2 Up shares. The value of each share is then also halved, ensuring that the investor is back at the intrinsic value they are entitled to. Does this imply that market prices should adjust back to intrinsic value after a Corrective Distribution? Not necessarily. The Issues It is claimed that the Authorized Participants will utilize arbitrage trades to keep the market prices in line with intrinsic value. The arbitrage trade is as follows: If market prices are higher than intrinsic value, purchase more primary shares from the ETF provider, and sell them in the market. The increased supply will reduce the market price and move prices in line. A similar argument holds for the reverse. Why will this not work? The futures market guarantees that there will always be a premium/discount for these shares, and this depends on the degree of contango in the market. It goes even further than this; the market price as of the 11th of June 2015 of the VXUP share is trading at a 12.95% premium to its intrinsic value, the contango between front-month and the closest back-month future is 11.72% (as of 11 June 2015). As an example of why this is so, think of a simple VIX futures market that is in contango (standard situation). This means that purchasing near-term futures are cheaper than longer-term futures. It also means that futures prices are above the spot price. VIX futures prices will converge toward the underlying index value at maturity. Consider the case where the VXUP share has intrinsic value equal to the VIX underlying value (this is a simplifying case) and it is trading in the secondary market at intrinsic value. If you purchased the share, and shorted the front-month future, you would make a positive amount right now (because the future is more expensive than spot). In the future, you would simply deliver the share you are holding that trades at intrinsic value (which is necessarily the VIX index value at that time). Thus, for no future loss and positive gain now, you have found an arbitrage opportunity. If market participants exploited this opportunity, they would bid up the price of VXUP to more than its intrinsic value, introducing the premium. And, this premium would equal the degree of contango. If one factors in the Daily Amount, it simply reduces the return on the VXUP share and reduces the premium the market impounds into the price of VXUP, by the exact Daily Amount. Thus, the Authorized Participants and the market are at odds. The sum of the premium and discount should sum to zero, however, will not disappear because AccuShares requires the shares to be created in pairs. Why are these premiums an issue? The primary issue around these premiums relates to the corrective distribution. Remember, a corrective distribution occurs if there has been a consistent premium of 10% for 3 consecutive days. The corrective distribution then does a stock split and issues the other share class. The issue is reinvestment fees that would be incurred from these distributions. One would end up with the opposite share to what is desired at the end of a period and this would then need to be sold at a discount to what you should get at intrinsic value, resulting in a loss. And brokerage fees. Conclusion The problem of tracking VIX returns is not a new one. Products such as VXX sap investor funds due to their negative roll yield. A variety of other structural issues limit their effectiveness. While VXUP would provide exposure to the VIX index, it does it at considerable cost (4.5% a month if the VIX is below 30) and risk (corrective distributions incurring trading costs). An additional risk in the product is that the prospectus does not guarantee regular distributions will be provided in cash – they may be issued in paired-share equivalents to maintain fund liquidity. From the prospectus: ” Regular and Special Distributions will ordinarily be made in the form of cash during the first six months of trading in the Fund’s shares. Thereafter, the Fund will pay all or any part of any Regular or Special Distribution in paired shares instead of cash where further cash distributions would adversely affect the liquidity of the market for the Fund’s shares or impact the Fund’s ability to meet minimum asset size Exchange listing standards. All payments made in paired shares shall be made in equal numbers of Up and Down Shares. To the extent a share distribution would result in the distribution of fractional shares, cash in an amount equal to the value of the fractional shares will be distributed rather than fractional shares. ” Waiting on the sidelines and seeing how the fund deals with corrective distributions and tracking errors is the best course of action at the moment. I would like to credit Vance Harwood’s blog post over at Six Figure Investing for aiding in the research of this instrument. Disclosure: I/we have no positions in any stocks mentioned, and no plans to initiate any positions within the next 72 hours. (More…) I wrote this article myself, and it expresses my own opinions. I am not receiving compensation for it. I have no business relationship with any company whose stock is mentioned in this article.

Last Week’s Best Performer- Acadia Healthcare Company

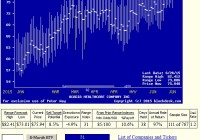
Summary One of 20 ranked (#11th) as best-odds for wealth-building from coming-price forecasts implied by market-maker [MM] hedging on 6/17/2015. Its target upside price of 78.38 was reached (within ½%) on 6/22/2015’s close at $77.99 after a day’s high of $78.50. ACHC’s +7.7% gain in only 5 calendar days produced a huge annual rate, but was only one of 27 hypothetical positions closed on that strong market-performance day. Their average gain of +9¼% in average holding periods of 33 days from prior lists of top20 MM forecasts resulted in gains at an average annual rate of +166%. Let’s look at what specific circumstances created this bonanza. How to build wealth by active investing Passive investing doesn’t do it nearly as well. SPY is now up in price YTD 2015 at an annual rate of 4.5%. Market-Maker [MM]-guided active investing this year, has identified 1281 such closed-out positions as ACHC, 20 a day. They earned at a +31.4% rate. That’s some 2700 basis points of “alpha” better than SPY. Our “leverage” is not financial. Those results are all from straight “long” positions in stocks or ETFs, no options, futures, or margin. We have the “leverage” of perspective. The perspective of market professionals who know, minute by minute, what their big-money “institutional” portfolio manager clients are trying to buy, and to sell, in the kind of volume that can’t be done with ordinary trades. Not only which securities, but at what prices. And on which side of each block trade their firm is being called on to put the firm’s capital at risk to bring the transaction to balance. We get that perspective by knowing what is meant by the way the MMs protect themselves when they hedge their capital exposures. Their actions tell just how far the market pros think prices are likely to get pushed, both up and down. That perspective is an important leverage, but it is magnified by the way we use perspective on the other key investing resource that is required: TIME. Here is what makes active investing active. We not only buy, we sell. We sell according to plan. The plan is set at the time we buy. An explicit price target is set then, with a time limit to our patience for it to be accomplished. We are investing time alongside of our capital. If the sell target price is not reached by when the time limit arrives, the position is sold, gain or loss on the capital is taken, and both capital and time are ready, positioned for immediate reinvestment. Active investing keeps its capital working all the time, it does not try to time the overall market, nor does it make uncompetitive investments in the market, ones which would accept single-digit rates of return in fear of seeing a loss or having to accept one in order to keep capital and time working diligently. Perspective and time-discipline can keep the odds of having winning holdings positions in favor of active investors. Three wins for every loss is quite doable, and the ratio even reaches seven out of every eight. Here are the specifics of how it worked for ACHC Figure 1 pictures how the market-making community has been viewing the price prospects for Acadia Healthcare Company, Inc.(NASDAQ: ACHC ) over the past six months. Figure 1 (used with permission) The vertical lines of Figure 1 are a visual history of forward-looking expectations of coming prices for the subject stock. They are NOT a backward-in-time look at actual daily price ranges, but the heavy dot in each range is the ending market quote of the day the forecast was made. What is important in the picture is the balance of upside prospects in comparison to downside concerns. That ratio is expressed in the Range Index [RI], whose number tells what percentage of the whole range lies below the then current price. A low RI means a large upside. Today’s Range Index is used to evaluate how well prior forecasts of similar RIs for this stock have previously worked out. The size of that historic sample is given near the right-hand end of the data line below the picture. The current RI’s size in relation to all available RIs of the past 5 years is indicated in the small blue thumbnail distribution at the bottom of Figure 1. The first items in the data line are current information: The current high and low of the forecast range, and the percent change from the market quote to the top of the range, as a sell target. The Range Index is of the current forecast. Other items of data are all derived from the history of prior forecasts. They stem from applying a T ime- E fficient R isk M anagement D iscipline to hypothetical holdings initiated by the MM forecasts. That discipline requires a next-day closing price cost position be held no longer than 63 market days (3 months) unless first encountered by a market close equal to or above the sell target. The net payoffs are the cumulative average simple percent gains of all such forecast positions, including losses. Days held are average market rather than calendar days held in the sample positions. Drawdown exposure indicates the typical worst-case price experience during those holding periods. Win odds tells what percentage proportion of the sample recovered from the drawdowns to produce a gain. The cred(ibility) ratio compares the sell target prospect with the historic net payoff experiences. Figure 2 provides a longer-time perspective by drawing a once-a week look from the Figure 1 source forecasts, back over two years. Figure 2 The success of a favorable outlook comparison for ACHC on June 17 was not any rare magic of the moment. It just happened that enough reinforcing circumstances came together on that day to make the forecast and its historical precedents look better than hundreds of other investment candidate competitors. Those dimensions are highlighted in the row of data items below the principal picture of Figure 1. The balance of upside to downside price change prospects in the forecast sets the stage of similar prior forecasts. They were followed by subsequent favorable market price changes that turned out on that day to be competitive in the top20 ranking of over 2500 equity issues, both stocks and ETFs. On other days luck would have it that several additional stocks were included in the daily top20 lists, and then on June 22nd would reach their sell target objectives. Figure 3 puts the same qualifying dimensions as ACHC in Figure 1 together for the days their forecasts were prescient. Then Figure 4 lists them with their closeout results. Figure 3 (click to enlarge) Figure 4 (click to enlarge) Columns (1) to (5) in Figure 4 are the same as in Figure 3. Columns (6) to (11) show the end of day [e.o.d.] cost prices of the day after the forecast, e.o.d.prices on June 22nd, the resulting gains, calendar days the positions were held from the forecast date, and the annual rates of gain achieved. Several things are to be noted. A number of the positions are repeat forecast days for the same stock. This does not make them any less valid, since investors are posed with the recurring task of finding a “best choice” for the employment of liberated or liquidated capital “today” and these issues persisted in being valid competitors for that honor for a number of days. Note that they are not always sequential days. Further, the TERMD portfolio management discipline uses next-day prices as entry costs for each position. Here for Healthsouth Corporation (NYSE: HLS ) the price rose about +10% from $43.29 to $47.41 on the day. It was still included in the scorecard, although a rational investor judgment call might have eliminated it from the choices. As a result, its target-price closeout on the 22nd resulted in a diminished 0.4% gain and a +14% AROR. Also you may note that some of the closeout prices are slightly less than their targets. This is to recognize that investors often become concerned that positions getting close to their targets sometimes back away, losing a gain opportunity and the related time investment. So our sell rule is to take any gain that gets within ½% of the target price. But all exit prices are as e.o.d., so some are above the sell targets, like the 5/21/2015 Aetna (NYSE: AET ) position at $128 instead of $125+. Conclusion These 27 ranked position offerings are an illustration of how active investing takes advantage of the sometimes erratic movements of market prices. It is in the nature of equity markets that investors sometimes get overly depressed and overly enthusiastic. By being prepared for opportunities when they are presented, the active investor often can pick up transient gains that subsequently disappear. This set of stocks is not abnormal in the size of its price moves. They averaged +9.3% gains, and the 2015 YTD average target closeout gains are running +10%. What is unusual in this set is that their time investment has been brief, only 33 calendar days on average, producing an AROR for the set of +165%. Part of the explanation lies in these 27 positions all being successful in reaching their targets. The 2015 YTD target-reaching average (952 of them) took only 46 days to make +10% gains, for an AROR of 113%. The overall YTD average in 2015 is 57 days, including positions closed out by the time limit discipline, making the AROR a more reasonable +31%. But that is well ahead of a passive buy & hold rate of gain in SPY of +4.5%. The man said “It ain’t braggin’ if ya can do it.” We are doing it, have done it before, and have been goaded into this display by passive investment advocate SA contributors whose statements infer that active investors invariably lose money. That’s just not so. We are not in an investment beauty contest with those whose capital resources are extensive enough to allow them to live comfortably off the kinds of placid returns that passive investing typically provide. They are to be congratulated. Our aim is to let investors who are facing financial objective time deadlines that cannot be met by “conventional conservative investing practices” know that there are alternatives that are far more productive and far more risk-limited than they have been led to believe. Alternatives numerous and consistent through time which we intend to continue to record and display. Disclosure: I/we have no positions in any stocks mentioned, and no plans to initiate any positions within the next 72 hours. (More…) I wrote this article myself, and it expresses my own opinions. I am not receiving compensation for it (other than from Seeking Alpha). I have no business relationship with any company whose stock is mentioned in this article.