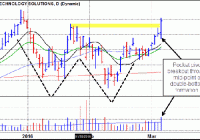
M/A-Com Technology Solutions (MTSI) GM – Nice pocket pivot breakout through the mid-point of the “W” in a double-bottom formation. I actually notice a pocket pivot off the 50-day line four days earlier, so we could say we were late on this one. Would prefer to buy this on a pullback towards the rising 10-day line, now at 38.76. Dr.K – Its industry group, semiconductors, has made a strong comeback along with the small cap Russell 2000 as capital flows into risk-on type stocks. SolarEdge (SEDG) GM – Big-volume pocket pivot runs into resistance near the top of the two-month range and we see a pullback to the 50-day line as volume declines. This brings the stock into a lower-risk entry point with the idea that it should hold the 50-day line with maybe 2-3% porosity allowed for on the downside. Dr. K – The stock closed at its 50-day line thus risk in buying at this level is minimal provided one keep their stops tight as should the current bounce in the general market back-and-fill or roll over, volatile stocks such as SEDG could fall faster. Alaska Airlines (ALK) GM – A nice pocket pivot off the 50-day moving average in a “roundabout” type of position where the stock is coming up the right side of a potential new base. Notice how the bottom of the base sets up as a double-bottom shakeout. Would look to buy this on pullbacks into the 10-day line at 75.24. Dr. K – Airlines have shown renewed strength over the last few weeks. ALK has skated along its 10-day line since it bottomed. Buying as close as possible to its 10-day will keep risk to a minimum. Silicon Motion (SIMO) GM – SIMO has flashed two pocket pivots this past week, one on Monday and one on Friday. The stock remains in a buyable position here along the 10-day line. I would use the 20-day exponential moving average at 32.65 as a maximum selling guide. Dr. K – Another semiconductor stock showing strength as it enjoyed a big move when it reported earnings after the close on 1/28. Semiconductor stocks tend to be more volatile so giving it a little more wiggle room is an option such as a stop under the low set on 2/25. Super Micro Computer (SMCI) GM – SMCI had some nice follow-through after Monday’s pocket pivot, but it gave up most of that three-day move on Friday when it came in sharply on light volume. This of course brings it into a lower-risk buy position based on the “voodoo” pullback to the 10-day line. I would use the 20-day exponential moving average at 31.69 as a maximum selling guide. Dr. K – The right side of its base has experienced two gaps higher with the most recent gap due to a strong earnings report. This stock can be choppy as it challenges former resistance points so using the 20-day exponential line will keep losses in check. O’Reilly Automotive (ORLY) GM – ORLY has shown a lot of buying volume support at its January and February lows, and so it keeps making runs back up towards its prior highs each time. The stock looked strong on Tuesday but sent the next three days pulling into the 10-day line. Friday’s above-average volume came as the stock was able to hold the 10-day line, which could be interpreted as supporting action at a lower-risk entry point. I would use the 20-day exponential moving average at 259.62 as a maximum downside selling guide. Dr. K – ORLY has pulled back for 3 days with the last 2 days on above average volume, closing roughly midbar each time. Overall, ORLY has displayed considerably more strength than the NASDAQ Composite as it is just 4% from hitting new highs. The weekly chart shows it trades in a tight, constructive fashion. It breaches its 50-day line only when the general market undergoes a steep correction then quickly recovers. Fabrinet (FN) GM – This is a bit of a disappointment as the stock looked strong posting a supporting type of pocket pivot off the 20-day exponential moving average on Tuesday, but then rolled over on Thursday as volume picked up sharply. It has, however, been able to hold above the intraday low of the early February buyable gap-up. This would bring it into a possible buy position using the BGU intraday low at 27.34 as a very tight stop. Dr. K – Risk here is very low were one to initiate a position as since the stock has traded above the low of its BGU for more than 5 days, so no porosity is needed when setting the stop. An undercut below the low of its low on its BGU day would trigger a sell. Â
