EQT Corporation: Understanding Marcellus Economics
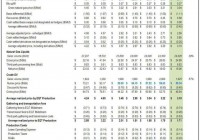
Summary The Marcellus macro environment remains challenging, even for low-cost producers with strong marketing portfolios. Using the EQT example, the article lays out various components of the “buildup” between the wellhead price in the Marcellus and the Henry Hub price. The analysis lends support to the thesis that the current depressed natural gas price environment is not sustainable. IMPORTANT NOTE: This article is not an investment recommendation or research report. It is not to be relied upon when making investment decisions – investors should conduct their own comprehensive research. Please read the Disclaimer at the end of this article. EQT Corporation (NYSE: EQT ) is not immune to the challenges the current deeply depressed natural gas price environment presents for North American natural gas producers. In the Marcellus and Utica, the problem is exacerbated by the wide local differentials that have persisted at many pricing points, often diminishing the area’s geologic and economic advantage over other supply sources. Thanks to its extensive marketing portfolio, which includes firm transportation agreements and basis and Henry Hub hedges, EQT has remained relatively well protected against the extreme weakness of natural gas prices within the Marcellus/Utica area. By settling its basis hedges, selling excess transportation capacity and moving some of its gas to more attractive pricing points, EQT has been able to “recover” a significant portion of the local basis differential. Still, in 2014, the company effectively sold its natural gas at a discount to Henry Hub. In 2015, EQT’s price realizations will continue to benefit from such basis recoveries, as well as Nymex hedges and price uplift from NGLs. Still, the combination of depressed Nymex prices, deep local differentials and weak oil and NGL pricing may take a heavy toll on the company’s drilling economics this year. Having said that, the extreme weakness of natural gas prices cannot be sustained for long. Understanding Marcellus Price Realizations Understanding price realization build-ups for Marcellus natural gas producers can be a tedious and confusing task. Reporting formats differ from company to company, and there is no uniform convention that operators would use when presenting data. The following table may be helpful in understanding production economics in the Marcellus using EQT as example. The table shows historical price realization reconciliation for Q4 2014 and full-year 2014, as reported by the company, as well as my illustrative scenario for 2015. (click to enlarge) (Source: Zeits Energy Analytics, February 2014) One could think of the net price realization as a “build-up” that takes the Henry Hub price as a starting point, with several add-ons and deducts: The “Btu uplift” line in the Natural Gas section of the table reflects the fact that, on average, EQT’s natural gas sold has a higher Btu content than the NYMEX specification, primarily as a result of ethane rejection. Because of that higher Btu value, the company realizes a higher price per Mcf. For example, in Q4 2014, EQT realized a Btu content premium for its natural gas of $0.39 per Mcf. The “average differential” line includes: the impact of local basis (the differential between Henry Hub price and the average price that EQT would realize by selling its natural gas at local trading hubs); recoveries received from selling some of the company’s natural gas into higher-priced markets and recoveries from the resale of unused takeaway capacity; and the impact of cash-settled basis swaps. In Q4 2014, EQT was able to “recover” a portion of the basis differential equal to $0.88 per Mcf. In addition, it gained another $0.30 per Mcf via basis swaps, for a total of $1.18 per Mcf. As a result, the company’s Q4 2014 price received per processed Mcf, before hedges, was effectively higher than the Nymex price ($4.08 per Mcf versus $4.01 per MMBtu). The company’s natural gas hedges and other price derivative contracts also contribute to (or deduct from) the net price realization. In Q4 2014, EQT realized a combined gain of $0.14 per Mcf from this category of contracts. Crude oil and NGL components of the production stream provide a further uplift to the average price realization. On an equivalent basis, including hedges, EQT realized $4.24 per Mcf of equivalent production in Q4 2014. In order to deliver its natural gas from the wellhead to various sales points, EQT must pay gathering and transmission fees (in some cases, under take-or-pay contracts). In Q4 2014, the company’s combined gathering and transmission fees per Mcf averaged $1.36 per Mcf. Much of this amount ($0.91 per Mcf) was paid to the sister company EQT Midstream. Adding all these components together, EQT Production’s Q4 2014 net price realization was $2.88 per Mcfe. EQT is a low-cost operator. Its total cash operating cost (including LOE, production taxes and SG&A) in Q4 2014 was $0.47/MMcfe. This cascade leads to a cash netback to EQT Production in Q4 2014 of $2.41 per Mcfe. The above layout helps to single out key factors that drive economic margins (for EQT Production, in this case) and may help to address some common misconceptions. Henry Hub is not the most indicative benchmark for Marcellus operators. Many pricing points in the Consuming East region are characterized by strong seasonality, and may yield high premiums during peak seasons and trade at discounts during shoulder seasons. Access to premium pricing points requires transportation contracts. As a result, many Marcellus producers have diversified and highly complex portfolios of marketing arrangements. Transportation contracts and basis swaps are integral components of such portfolios. Calculating the net price realization on a quarter-to-quarter basis may be a difficult task for outsiders. “Macro hedges” (typically using Nymex) are perhaps the only component of the net price realization that can be completely disintegrated from the marketing portfolio. Its impact can be calculated separately. Gathering fees and transportation fees are the largest (and in many cases fixed for decades) cost components for the majority of natural gas producers in the Marcellus and Utica area. The very wide local basis differential for volumes not covered by transportation agreements is, in essence, a spot transportation cost . Field operating costs (LOE, production taxes and field G&A) are the smallest cost components. This cost category often reflects the operator’s position in the field’s exploitation life cycle and the liquids content in the production stream: operators that are still delineating their acreage and operate in the rich and super-rich windows will tend to have higher field operating costs. The price uplift from NGLs may be not as significant as sometimes portrayed due to the very high third-party processing fees that often apply. EQT’s 2015 Cash Flow May See Strong Contraction Using the current Nymex futures strip for 2015 and making certain assumptions, I estimate that even after giving credit to EQT’s hedges, the company’s cash netback per Mcfe will decline by approximately one-half year-on-year in 2015 to ~$1.24 per Mcfe. The company will be able to capture additional economic benefits via its ownership of EQT Midstream. However, this illustrative calculation shows that in the absence of a strong improvement in the overall natural gas price environment, new drilling would be marginally economic even for a low-cost operator like EQT. Using the price realization model outlined above, I derive 2015 EBITDA for EQT Production of ~$750 million, an almost two-fold reduction from 2014, despite the expected meaningful growth in production volumes. (click to enlarge) (Source: Zeits Energy Analytics, February 2014) On a consolidated level, the decline in the company’s cash flow will be partially mitigated by the resilience of its midstream business: EQT is experiencing strong volumetric growth, and its operating margins are largely protected by the long-term contracts. Still, the company may have to utilize most of the $950 million cash balance it had at the end of 2014 to fund its current spending plan. Despite the significant announced reduction in the number of new wells drilled, EQT Production is still expected to spend substantially in excess of its cash flow. The company’s 2015 drilling and completion budget is currently set at $1.85 billion, a slight uptick from $1.7 billion in 2014. The plan envisions an average of 12 operated rigs run throughout the year (8 deep drilling rigs running and 4 spudder rigs), down from 15 rigs currently. A significant portion of the 2015 capex is designated for completing wells that have already been spud. As of year-end 2014, EQT had 191 wells spud but not yet on production, including 23 wells that had been already completed but were not on-line yet. The company’s guidance of 575-600 Bcfe total production in 2015 implies continued strong growth of ~24% year-on-year (slide below). (click to enlarge) (Source: EQT Corporation, February 2015) However, as a result of the extremely weak commodity prices, this growth will come at the price of a significant outspend relative to the internally generated cash flow. Over half of EQT’s natural gas volumes are protected with Nymex hedges with attractive prices (the graph below). In the absence of such hedges, the outspend in 2015 would be even more pronounced. (click to enlarge) (Source: EQT Corporation, February 2015) Drilling Economics The review of EQT’s drilling economics in the Marcellus indicates that the current natural gas price environment is hardly sustainable for long. The following two slides from the company’s latest presentation suggest that even in its most prolific and most economic areas, a realized price of $2.80-2.90 per Mcf is required to generate a competitive drilling return at the well level (which I define as at least 20%). Assuming that the “realized price” measure on the slides corresponds to the “Average realized price by EQT Production” (which was $4.24 in Q4 2014), the company’s upstream operation was highly economic in 2014. In 2015, the company will continue to generate compelling returns on its new drilling program. However, these returns will be driven by short-term financial macro hedges (Nymex Henry Hub hedges). In the absence of such financial hedges, the company’s drilling would be marginally economic or uneconomic, assuming no improvement in natural gas prices from their current levels. Given that the degree of hedge coverage throughout the industry will decline in 2016 relative to 2015, natural gas prices would have to recover or supply will decline due to significant new drilling curtailments. (click to enlarge) (click to enlarge) (Source: EQT Corporation, February 2015) Disclaimer: Opinions expressed herein by the author are not an investment recommendation and are not meant to be relied upon in investment decisions. The author is not acting in an investment, tax, legal or any other advisory capacity. This is not an investment research report. The author’s opinions expressed herein address only select aspects of potential investment in securities of the companies mentioned and cannot be a substitute for comprehensive investment analysis. Any analysis presented herein is illustrative in nature, limited in scope, based on an incomplete set of information, and has limitations to its accuracy. The author recommends that potential and existing investors conduct thorough investment research of their own, including detailed review of the companies’ SEC filings, and consult a qualified investment advisor. The information upon which this material is based was obtained from sources believed to be reliable, but has not been independently verified. Therefore, the author cannot guarantee its accuracy. Any opinions or estimates constitute the author’s best judgment as of the date of publication, and are subject to change without notice. The author explicitly disclaims any liability that may arise from the use of this material. Disclosure: The author has no positions in any stocks mentioned, and no plans to initiate any positions within the next 72 hours. (More…) The author wrote this article themselves, and it expresses their own opinions. The author is not receiving compensation for it (other than from Seeking Alpha). The author has no business relationship with any company whose stock is mentioned in this article.

