Tag Archives: managed-futures

Crisis Alpha: Surprising Ways To Hedge Stock Portfolio Risk

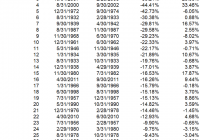
By Wesley R. Gray Investing in the current environment is difficult. Most, if not all, asset classes have high nominal prices, suggesting low nominal expected returns. Not exactly exciting. And for many investors who are retired and/or have near-term liquidity needs, investing in equity exposures – while necessary to generate higher expected returns – also prevents many investors from sleeping at night! One solution to curb the risk of a massive market meltdown is to buy portfolio insurance. However, in a rational world, insurance contracts are expensive because they protect us when we need protection the most. Insurance has this pesky problem of charging a large premium for downside protection. For example, consider put options on the S&P 500 market index. If an investor wants to hedge against a 10% drawdown for a year, the cost (as of August 13, 2015) would be approximately 4% of the notional value to be hedged. So if you had a $1,000,000 stock portfolio and wanted to ensure the most you could lose was $100,000, the cost of that insurance for one year would be around $40,000. Clearly, buying portfolio insurance can be expensive. But what if we could identify unique assets where the cost of insurance was much lower? We’ve identified 3 candidates that may fit this profile: US Treasury Bonds Hedge Fund Factors Managed Futures We highlight some of the historical evidence of the abilities of these assets to provide portfolio insurance (they go way up, when stock markets go way down). Of course, past performance is no guarantee of future performance, and nobody can know what will happen in the future, but the results inspired us to dig a little deeper and think harder about our own portfolio construction efforts. 1. US Treasury Bonds The results below highlight the top 30 drawdowns in the S&P 500 Total Return Index from 1927 to 2013. Results are gross of management fees and transaction costs. All returns are total returns and include the reinvestment of distributions (e.g., dividends). Next to the S&P 500 return is the corresponding total return on the 10-Year (LTR) over the same drawdown period. Bottom line: When the market blows up, flight-to-quality 10-Years have done well. (click to enlarge) The results are hypothetical results and are NOT an indicator of future results and do NOT represent returns that any investor actually attained. Indexes are unmanaged, do not reflect management or trading fees, and one cannot invest directly in an index. Additional information regarding the construction of these results is available upon request. 2. Hedge Fund Factors We examine 3 common hedge fund “factor” portfolios alongside the S&P 500 Index: S&P 500 = S&P 500 Total Return Index HML = The average of 2 value portfolios (small and large) minus the average return of two growth portfolios (again, small and large) MOM = The average of 2 high return portfolios (small and large) minus the average return of two low return portfolios (small and large) QMJ = The average of 2 high-quality portfolios (small and large) minus the average return of two low-quality portfolios (small and large) Results are gross of management fees and transaction costs. All returns are total returns and include the reinvestment of distributions (e.g., dividends). Data are from AQR and Ken French . Next to the S&P 500 return is the corresponding total return on hedge fund factors over the same drawdown period. Bottom line: When the market blows up, hedge fund factors have done well. (click to enlarge) The results are hypothetical results and are NOT an indicator of future results and do NOT represent returns that any investor actually attained. Indexes are unmanaged, do not reflect management or trading fees, and one cannot invest directly in an index. Additional information regarding the construction of these results is available upon request. 3. Managed Futures Here we examine a chart from a white paper by the folks at AQR. The paper is called, “A Century of Evidence on Trend-Following Investing.” The trend-following concept analyzed can be considered a generic managed futures strategy. Bottom line: When the market blows up, trend-following managed futures have done well. (click to enlarge) The results are hypothetical results and are NOT an indicator of future results and do NOT represent returns that any investor actually attained. Indexes are unmanaged, do not reflect management or trading fees, and one cannot invest directly in an index. Additional information regarding the construction of these results is available upon request. Conclusion Historically, Treasury Bonds, Hedge Fund Factors, and Managed Futures have all managed to act like portfolio insurance, even though they aren’t traditionally considered insurance assets. Will this pattern continue in the future? Who knows…and of course, that is the million dollar question… Let us know if you’ve seen other hidden portfolio insurance options out there. Please share ideas… Original Post
Decoding The Myths Of Managed Futures 2015

This paper examines seven very popular myths and misconceptions held by both retail and institutional investors regarding managed futures. These myths have persisted for several years. Knowing if the myths are true or false is critical for an investor’s understanding and appreciation of managed futures. From presenting at more panel events, instructing workshops on alternative investments and teaching my managed futures/ global macro course at DePaul University in the last several years, I found it was time to update the original paper written in 2011 with additional myths added to the list. The demand for alternative investments continues to grow as investors are seeking more ways to decrease their correlation risk and tail risk of their portfolio. After the dot com bubble and the recession in the early 2000s more investors realized the need for wider diversification beyond stocks and bonds. More recently since the financial crisis the demand to reduce correlation risk and tail risk continues to grow. Managed futures (AKA Commodity Trading Advisors), a subset of alternative investments and sometimes categorized under global macro hedge funds continues to grow in popularity. However, many old myths still persist about the investment product, the managers and the due diligence of the managers. As of the end of 2014, assets under management have grown by 736% since 2000 and by 53% since 2008, according to BarclayHedge . 2011, 2012 and 2013 were challenging years for the returns of managed futures and the product found itself out of favor. But no one has a crystal ball to know when markets change and the 2nd half 2014 gave CTAs a positive year while equities were experiencing greater volatility in the latter part of 2014. As of March 2015, CTAs continue to profit. A fair amount of the recent growth in managed futures has been driven by the increasing interest for both commodity related investments as well greater non-correlation of portfolio allocations. Below are some of the myths and misconceptions of managed futures: Mysterious “black box” trading systems Managed futures are a hedge or insurance against equities Only commodities are traded Managed futures are risky and volatile All Commodity Trading Advisors are the same CTA indices contain survivorship bias All CTAs are large firms The discussions below are tendencies of the managed futures industry. Results may vary with individual managers. 1: Mysterious “Black Box” Trading Systems Over the years I’ve often heard investors or allocators state “we don’t understand or can’t get comfortable with the systematic trading models” and “they are black boxes, so we stay away from them.” Systematic trading models are quantitative computerized trading models. In earlier years, many CTAs were cautious of fully explaining their models due to replication risk. However, in more recent years there is a trend towards CTAs explaining their models. But the transparency by the CTA is not enough. It also involves the investors and allocators to do their research in understanding the concepts and terminology of the asset as they do their due diligence, just as they would for any other investment. 2: Hedge or Insurance against Equities Many believe that managed futures are a hedge or insurance against equities. This is not true. CTAs tend to be non-correlated to equities. This means their returns are independent of equity returns. The independent returns are primarily due to CTAs trading various commodity and financial markets and they can be long, short, neutral or spreading in those markets. In the last 20 years managed futures have shown moments of having a positive correlation to equities when equities rally and in other moments a negative correlation to equities when equities decline. Over time the correlation cycles between positive and negative. But they tend to show positive performance when there are “shocks” to the various markets or the economy such as in the early 2000’s and in 2008. A CTA does not care about the direction of the market they trade, but only that there is enough of a move to create a profit. 3: Only Commodities Are Traded Because the managers who trade futures are called Commodity Trading Advisors, there is a myth that only commodities are traded. Some CTAs do trade only commodities or only trade one market or sector such as corn or the grain sector. But many trade only financial futures such as stock index futures, bond futures or currency futures or forwards. Diversified CTAs may trade both financial and commodity futures. 4: Managed Futures Are Volatile Some CTAs can be volatile, just as any other investment has the potential to be volatile or risky. However, if you look at volatility in terms of the Sharpe ratio and or standard deviation, then you are also assuming the return distributions are a normal (bell-curve) distribution. CTAs may have low Sharpe ratios, high standard deviations, thus one would believe they are very risky and volatile. However, the low Sharpe ratio and high standard deviation are often derived from positive skewness of the return distribution due to risk management policies. One must understand the source of volatility returns. Volatility is similar to cholesterol; there is good volatility and bad volatility. Good volatility is derived from positive returns and the bad volatility derived from negative returns. The Sortino ratio and S-ratio are probably more informative in understanding risk-adjusted returns for a non-normal distribution than the Sharpe ratio or standard deviation. It may sound counter-intuitive, but adding an investment with a high standard deviation may actually reduce the portfolio’s volatility due to the positive skewness. In doing so to analyze the investment not as a standalone investment, but how does it compliment the portfolio. 5: Managed Futures Funds Are All the Same Some investors will ask “why do I need to invest in more than one CTA? Aren’t all CTAs the same?” The answer to that is NO! This topic can be detailed in a separate discussion, but they are not all the same for some basic reasons: 1) Some CTAs may trade different markets or varying number of markets. 2) Their time horizons or average trade duration may vary. 3) How they get into or out of positions may vary. 4) How they manage risk, one of the most important components of the trading system may vary among the CTAs. As I tell my students at DePaul University, the risk management of the positions may make or break a manager. 6: CTA Indices Contain Survivorship Bias Some investors will refrain from investing in managed futures because the indices include survivorship bias. They are correct, the indices usually do contain survivorship bias. This bias relates to managers being taken out of the index because they no longer meet a certain requirement to be in the index or they are no longer in business. Managers may also be taken out of an index because they stop reporting to the databases. One common reason for a manager to stop reporting their returns is if they reach a certain asset size and are no longer seeking to raise funds. What is often missed is that most investment indices do include survivorship bias. For example, General Electric was one of the original components in the Dow Jones index. They are now the only remaining original constituent. Over the decades DJ and S&P have added and removed companies from their respective indices. If survivorship bias is a reason for an investor to avoid investing in managed futures then why isn’t the same logic applied to equities? 7: All CTAs are Large Firms Often new investors in the managed futures space may know of a few large CTAs and think all CTAs are large firms with hundreds of millions if not billions of dollars under management, millions spent on technology, a large research staff and a deep infrastructure. However, it is more common for a CTA to be a small business. They will often have from 2 to 10 employees. Using easily accessible technology and many back office functions outsourced to third party firms. This should not take away from investing in the smaller “emerging” managers, but to understand and appreciate the makeup of the industry. In summary, we have discussed some of the myths or misconceptions that have persisted over the years regarding managed futures. As the industry has become more transparent of their research and demand for non-correlated assets have increased, there is a need for investors to do their research, understand the product, as they would with any other asset class they explore to invest in and understand the profile of the managers they investigate. Disclosure: I/we have no positions in any stocks mentioned, and no plans to initiate any positions within the next 72 hours. (More…) I wrote this article myself, and it expresses my own opinions. I am not receiving compensation for it. I have no business relationship with any company whose stock is mentioned in this article.