Beating The Market With Profit And Beta: An Exercise
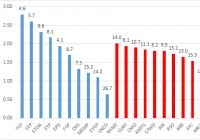
Summary Having established that low-beta stocks outperform, I posited that stocks with returns on invested capital much greater than their cost of capital would also outperform. I further posited that a portfolio comprised of the lowest-beta of these stocks would produce further risk-adjusted outperformance. Using the S&P 1500 as my pool of stocks to choose from, I simulated these strategies over the past 5 years. Here’s what I found. Having recently established in a separate article that low-beta stocks can strongly outperform the market, I wanted to see whether other approaches might outperform the market in an independent fashion, or else add to the alpha of a low-beta approach. I decided to look at whether or not companies with “economic moats” might outperform the broader market as well. The idea is certainly appealing. A company capable of sustaining an economic profit over time would probably benefit from what Morningstar typically contends are moat sources : Network effect, Intangible assets, Efficient scale, Cost advantage, and Switching costs. Certainly, a company imbued with these qualities would be expected to outperform the broader market over a full market cycle, and any discount on such a high-quality firm would be expected to dissipate relatively quickly as the market reestablished a premium reflective of these characteristics. This is the rationale behind certain exchange-traded funds like the Market Vectors Wide Moat ETF (NYSEARCA: MOAT ), and to some degree behind value-based methodologies practiced by Warren Buffett and others of his ilk. The problem, unfortunately, is that moatish qualities are difficult to quantify and may fade over time. A rough guess for the presence of an economic moat for a given firm has been posited by some as the firm being able to post a return on invested capital greater than its weighted average cost of capital, though certainly any given firm in a cyclical industry might be able to do so unreliably. What is probably more predictive is a demonstrated, sustained ability of a firm to generate an economic profit. These might be more readily found in stable industries with predictable dynamics. I posited that a strategy focused on firms with demonstrated sustained economic profits with business models suggestive of stable dynamics would outperform the broader market, and that this strategy would be also prove superior to a low-beta strategy alone. Experimental Method: I gathered 10-year financial data from Morningstar on each of the 1,500 components of the S&P 1500, as well as 10-year price data. I calculated yearly returns on invested capital for each company, and, starting with 2009, calculated a rolling 5-year average ROIC for each company between 2009 to the present. Beta was calculated in rolling 5-year increments using the S&P 500 (NYSEARCA: SPY ) as a benchmark, and a 5-year rolling cost of equity was calculated with the risk-free rate being a rolling average of 10-year treasury interest rates. Weighted average cost of capital was calculated using the normal method, with the cost of debt informally assumed to be either the yearly interest payment over the sum of short and long-term debt versus the interest rate suggested by the company’s interest coverage, whichever was higher. Economic profit was calculated as EVA = ROIC – WACC. From these metrics, the following strategies were simulated: A low-beta strategy, with monthly rebalancing into an equal-weighted portfolio of 12 stocks. On a monthly basis, the entire portfolio would be redistributed into the 12 stocks with the lowest rolling beta values, regardless of valuation. An economic-profit strategy, with monthly rebalancing into an equal-weighted portfolio of 12 stocks. Pre-screens for yearly profitability (e.g., positive yearly EPS) in addition to a positive 5-year rolling EVA were applied. On a monthly basis, the entire portfolio would be redistributed into the 12 stocks with the lowest price to economic-profit ratio (hereafter, “PEVA”). A combined strategy, wherein the top 50 stocks with the lowest PEVA ratios were selected (using the aforementioned pre-screens), and, from these, the 12 with the lowest beta scores would be selected and equal-weighted on a monthly basis; this strategy was repeated using a quarterly rebalancing rule. These 3 strategies were then compared to the S&P 500 and S&P 1500, looking prospectively over the past 5 years. Results: (click to enlarge) As noted previously, a low-beta strategy generated significantly higher annualized returns than the broader market, by a significant amount (26.6% CAGR over the past 5 years versus 15.4% for the SPY and 18.4% for the S&P 1500): (click to enlarge) In comparison, a strategy focused purely on PEVA generated significantly higher returns than even the beta strategy, with a CAGR of 32.76%. (click to enlarge) Returns using a monthly rebalancing rule using a combination of PEVA and beta outperformed a lone beta strategy by nearly 1000 basis points, with a CAGR of 35.3% yearly. (click to enlarge) On a risk-adjusted basis, using a long-term risk-free rate assumption of 4.5%, the PEVA-beta strategy outperformed all other strategies, with a Sharpe ratio of 1.77 (versus 1.64 for low-beta alone). (click to enlarge) Overall, a combined PEVA-low beta strategy offered the strongest risk-adjusted returns over the past five years, and produced the strongest absolute annualized returns over the past 5 years with reasonable compensation for overall risk. Discussion: The results of this exercise suggest that a low-beta strategy may be enhanced by pre-selecting only those firms demonstrating the ability to generate sustained economic profits over time. The success of the PEVA strategy also suggests an underlying valuation component as well, as the strategy focused only on those stocks which had the highest economic profit yield relative to the price. It is worth noting that this strategy did not focus on a single year’s worth of data but rolling 5-year averages; additional study might consider looking at longer rolling averages of ROIC to see if this would affect returns. The astute reader will undoubtedly point out a significant limitation of this study is the relatively low volatility of the overall market during this timeframe, during which time there was virtually no period in which a yearly loss might be recorded. This obviously affects the relative performance of the low-beta or PEVA-beta strategies, though one would probably expect that, if anything, these strategies would be expected to outperform in bear markets. Finally, despite the encouraging results, the PEVA-beta strategy clearly has limitations. Changing the rebalancing period to quarterly shaves off nearly 1000 basis points worth of outperformance and puts the PEVA-beta strategy about on par with the beta strategy alone, reducing the Sharpe ratio to a pedestrian 1.17. Given that an ostensible goal of a focus on sustained economic profits would be to focus on companies capable of outperforming over years at a time, why quarterly rebalancing would diminish returns relative to monthly rebalancing remains a bit unclear. Conclusion: Though generating strong economic profits over time is not necessarily indicative of a stable, high-quality firm, doing so certainly can be suggestive. The success of the PEVA-Beta strategy in this study suggests that focusing on such firms may produce significant outperformance. Though monthly rebalancing costs might be substantial (and capital gains tax burdensome), such a strategy may be worth considering in sideways or downward markets where uncertainty reigns and volatility is high. Current stocks suggested by the PEVA-beta strategy include Coca-Cola (NYSE: KO ), Monster Beverage Corporation (NASDAQ: MNST ), the Brown-Forman Corporation (NYSE: BF.B ) and The Hershey Company (NYSE: HSY ). Other consumer defensive firms make the list, like Altria (NYSE: MO ); trucking firms Knight Transportation (NYSE: KNX ) and Landstar (NASDAQ: LSTR ) are also included.