Tag Archives: loader

Explaining Why The Portfolio-Barbell Works

One classic (liability-driven) portfolio strategy, known for obvious reasons as the “barbell,” entails a lot of very defensive low-beta assets on the one side, and a lot of aggressive high-beta assets on the other. Practitioners follow the advice of Mr. Bing Crosby: they don’t “mess with Mr. In-between.” For the most part, this is a practitioners’ strategy, not a theorists’ strategy. There’s been little reason in theory to think that it should work. After all. if you want diversification, why not include some assets in between those extremes? And if you don’t care for diversification, why not go whole hog with a “bullet” strategy? Despite its lack of conceptual foundations, practitioners continue to use it. Theory in Pursuit of Practice Donald Geman, a Fellow at the Institute of Mathematical Statistics and a professor of Applied Mathematics at Johns Hopkins, with expertise in machine learning, joins with two other scholars in writing a paper, now a preprint at arXiv, which seeks to put a foundation under this practice. The other authors are: Hélyette Geman of the University of London and… Nassim Nicholas Taleb, of black swans and anti-fragility renown. The gist of the paper, expressed non-mathematically, is that managers work with the facts they know. What they know is that they have to constrain the tails of their portfolio-return bell curve to satisfy various regulatory or institutional demands, Value at Risk, Conditional Value at Risk, and stress testing. The “operators,” as the authors call the decision makers in portfolio management, aren’t “concerned with portfolio variations” except insofar as they have “a vague notion of association and hedges.” They set out on the one hand to limit the maximum drawdown with investments at the conservative side of the scale in response to the sort of pressures and mandates just listed, then they move to the other end of the scale to seek to get the upside benefits of the same market uncertainties against which they’ve just protected themselves. In the course of making these points, the authors get in the by-now customary jabs at Modern Portfolio Theory. One footnote for example explains that MPT’s aim of lowering variance, thus its habit of treating the left-hand tail and the right-hand tail as equally undesirable, is rational only if there is certainty about the future mean return, or if “the investor can only invest in variables having a symmetric probability distribution.” And the authors consider neither premise plausible. The latter they find especially “farfetched.” From MDH to Entropy To get a bit more technical, their discussion elaborates on an existing literature on the “mixture” of two or more normals, the “mixture of distributions hypothesis.” It has been part of the finance literature for at least twenty years, since Matthew Richardson and Thomas Smith wrote a paper of the “daily flow of information” for the Journal of Financial and Quantitative Analysis in 1994. The underlying idea of the MDH is that information is moving into markets at uneven rates, and that this unevenness renders asymmetric distribution curves inevitable. In 2002, Damiano Brigo and Fabio Mercurio used MDH to calibrate the skew in equity options. What Geman et al. add is a model that makes “estimates and predictions under the most unpredictable circumstances consistent with the constraints.” They also, somewhat confusingly, call this a “maximum entropy” model. Entropy of course is a concept taken from the physical sciences, and the maximum entropic state for any system is one in which all useful energy has been converted into heat. Not a good thing. The idea has long been adopted into information theory, re-conceiving useful energy as signal and heat as noise. Thus, unsurprisingly, early efforts to introduce entropy into finance have seen entropy as something to be minimized. The Question in Unanswered Indeed, Geman et al are aware that their invocation of “maximum entropy” will seem an odd innovation to many of their readers. Most papers that have invoked entropy “in the mathematical finance literature have used minimization … as an optimization criterion” they say. Their use of a “maximum entropy” model (not as a “utility criterion” of course but as a way of recognizing “the uncertainty of asset distributions”) is itself not entirely novel though. They seem to have imported it from the world of developmental economics. In 2002 Channing Arndt, of the UN’s World Institute for Development Economics Research, witrh two associates, published an article announcing a ” maximum entropy approach” to modeling general equilibrium in developing economies, illustrating it with specific reference to Mozambique. Geman at al deserve some credit for their syncretism, their willingness to look in a variety of different places for the solution to the puzzle they’ve set themselves. Still, it seems to this layperson expert-on-none-of-it that the resulting construction is a ramshackle hut rather than a model. The simple question of why barbells work remains (so far as I can tell) unanswered.
Active Vs. Passive Investing: The Real Scoop

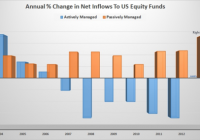
As of October 31st, investors had plowed over 60 billion into passive index funds this year while yanking over 80 billion away from actively managed funds. Statistics, on their face, can mislead us quicker than they can enlighten. Of all the US Large Cap Equity funds that had both high ownership and low cost, over 75% of them outpaced the indexes on a 5 year rolling return and. Like fitness bands and frappuccinos, index funds are high fashion. As of October 31st, investors had plowed over 60 billion into passive index funds this year while yanking over 80 billion away from actively managed funds. And why not? It’s well known most active managers do not outpace their benchmarks. Index funds are cheap, simple, and the upkeep is nominal. Indeed, more than ever, the joes, and pros, are turning to index based investing. On the other hand, we cannot deny the fact that investors feverishly jump into trends at precisely the wrong time. So, are index fund investors truly onto something or are they somehow being misguided? First, and for a quick refresher; index funds are investment vehicles that provide a way to closely mimic the returns of a specific index – such as the S&P 500. There are hundreds of indexes and over a thousand index funds. Each index is designed to track an area of a certain market and is formed by its own set of specific criteria. Since the criteria is based on objective data, there’s no need for an index fund to pay big money or bonuses to an investment manager as they need only copy their corresponding index. Consequently, the management of an index fund is largely administrative; hence, the low expense ratios and portfolio turnover. (Note: The data and observations provided are not exhaustive. All references herein are in regards to equity based funds only. ) Much of the frenzy over index funds has come from academic research showing that actively managed funds do not typically beat their respective index. For example, in a recent study by Standard & Poors, less than 30% of active fund managers outperformed their indexes in any given year between March 2009 and March 2014. Of the managers who did outperform the market, only a few did so with any significant edge. Of greater “consequence” to investors, over the 5 year period, less than 1% of the managers were able to return to the top quartile of funds for 5 consecutive years. What this means is that in that period of time, if you had simply invested in an S&P 500 index fund, which required no active portfolio management, you would have earned a better return than more than half of the portfolio managers. And this is just a small example, as there are many studies out there that point to the same thing – cheap, simple, index funds put the odds in your favor. Active managers rarely consistently beat the indexes therefore their typical 1.5% annual fee cannot be justified. So, considering the overwhelming evidence against active managers, it would be downright foolish not to join in with the index fund movement…..right? Well, not so fast. “There are lies, damned lies, and statistics.” – Mark Twain Statistics, on their face, can mislead us quicker than they can enlighten. Notwithstanding the reality that most active managers do in fact drift under the indexes, we must push onward, and look deeper into what information is being shown, or not. First, we need to acknowledge that these numbers do not include separate and private wealth managers. So, right off the bat we’re missing some of the very best in the business. (Ahem) That aside, what about the managers who do in fact consistently outpace their indexes? Are they just a lucky few? Maybe. But what if we could find a common characteristic, or positive correlation between them? Perhaps that would grab the attention of even the most dogmatic of index investors. Morningstar’s 2014 US Mutual Fund Stewardship Survey shows and highlights precisely these types of correlations. In the study, they discover two notable common characteristics between the top ranking active managers: High Manager Ownership – This firms where 80% of the assets managed have at least 1 manager owning 1 million dollars or more of the shares. Low Expenses – This is firms charging 1% or less. The report shows managers with these two characteristics exhibit very high levels of success. How high? Capital Group, a division of the behemoth American funds, took this research and dug even deeper to find some very powerful information. Their research piece, The Active Advantage , sifts through Morningstar’s research and highlights many interesting tidbits. One item they found stands out quite powerfully all alone: Of all the US Large Cap Equity funds that had both high ownership and low cost, over 75% of them outpaced the indexes on a 5 year rolling return and 100% of them beat the indexes on a 10 year rolling return. Therefore, by simply screening for funds with reasonable expenses and good ownership, we can completely reverse the aforementioned stats against active managers. While the oft maligned world of active management does have some merit, it seems unwise to forever close one’s mind to a concept that works incredibly well for so many. We simply need to find a better way to measure the quality of an active manager. Expenses, firm structure, and manager incentive is a start. The truth is, much of investing is about getting yourself, and your portfolio, on firm ground. Don’t make beating the market your only goal. Try to put the odds in your favor by focusing on things you can control such as expenses, taxes, portfolio cash flow, and of course proper incentive if you have an investment advisor or manager. Finally, it’s old hat, but I must say that chasing market returns, whether passively or actively, isn’t usually a good idea. Pouncing on the highest number as of late, is exactly that – late. Yet, oddly enough that is precisely how the industry works. Investors want to see good past performance, and many advisors screen and sell off off these high numbers. Active managers are continually being threatened by the rise of index funds so they’ve become even further pressured to outpace the indexes. That is, until the indexes turn around and head in the other direction. Unquestionably, much of this is a circular problem – with the average investor stuck in the loop.

Taking ETF Trades To The Next Level

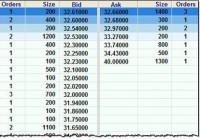
Experienced investors know the theory: ETFs are supposed to trade very close to their net asset value (NAV). And most of the time they do. But this week my PWL Capital colleague Justin Bender and I encountered a glaring exception that could have had expensive consequences. On Monday, Justin and I wanted to sell the iShares U.S. Dividend Growers Index ETF (CUD) in a client’s account. It was a large trade: more than 5,000 shares, which worked out to over $160,000. As we always do before making such a trade, we got a Level 2 quote, which reveals the entire order book. In other words, it tells you how many shares are being offered on the exchange for purchase or sale at various prices. By contrast, a Level 1 quote-the type normally available through discount brokerages-only tells you how many shares are available at the best bid and ask prices. If an ETF’s market maker is doing its job, there should be thousands of shares available at the best price. But we were surprised to find the Level 2 quote looked like this: Source: Thomson ONE Let’s unpack this. As sellers, we looked at the “Bid” column, and the best price (at the top of the column) was $32.61. But we’d be able to sell a mere 200 shares at that price, as revealed in the “Size” column to the left. We could unload another 400 for just a penny less, but after that the prices plummeted. Had we placed a limit order to sell 5,000 shares for $32.60 (one cent below the best bid price), we likely would have seen only 600 shares get sold. But that would have been a minor inconvenience compared to what might have happened if we’d placed a market order. Remember, a market order does not specify a minimum price you’ll accept when selling: it simply tells the exchange you will take whatever is being offered. Assuming a market order for 5,000 shares would have been filled according to the prices above, we would have received as little as $31.65 on the last few hundred shares-almost a full dollar lower than the best bid price. The average price for that market order would have been just $32.23, netting us proceeds of $161,150. Had we been able to sell all 5,000 shares at the best bid price-which is what we’d normally expect-we would have received almost $2,000 more . As you can imagine, we did not place this trade for our client. When market makers take a holiday This lack of depth in an ETF’s order book is very unusual. Even if an ETF is not frequently traded , market makers ensure that thousands of shares are available for purchase or sale at a price very close to NAV. So what was the reason for this anomaly? We can’t be sure, but Justin suspected it was because U.S. markets were closed on Monday (it was Martin Luther King, Jr. Day) while the TSX remained open. CUD is a Canadian-listed ETF, but its underlying holdings are U.S. stocks that were not trading that day: this would have made it more difficult for the market makers to determine the NAV of the fund. Indeed, the lot sizes were so small it’s unlikely they were posted by market makers at all: they may simply have been from individual investors. To test that idea, we got a Level 2 quote for another Canadian ETF that holds U.S. stocks: the Vanguard U.S. Total Market (VUN) . Sure enough, this one showed little market depth as well. Had you tried to sell more than 400 shares (or buy more than about 1,300) you may have seen your order filled at a surprising price. I checked the Level 2 orders for both ETFs again on Tuesday and the situation was completely different. Both funds had 20,000 to 30,000 shares available within a penny of the best bid and ask prices. Lessons learned This was a big trade that most retail investors would never make. But there important lessons from our little adventure that apply to anyone who uses ETFs. First, it’s the most dramatic example I’ve seen for why you should never use market orders . In this situation, a market order would have got you into trouble had you tried to trade as little as $20,000. On a very large trade like ours, it might have been a disaster. Second, avoid trading foreign equity ETFs when the underlying markets are closed. There are several American holidays when the Canadian market remains open, and these are not the days to be making large trades in ETFs that hold U.S. stocks. If you’re making a significant trade in an international equity ETF, it’s also a good idea to pay attention to time zone differences . Finally, if you have a large portfolio, consider subscribing to a service that provides Level 2 quotes. Check with your brokerage to see what is available, because practices vary a lot. Scotia iTRADE provides these free upon request, for example, while RBC Direct Investing and TD Direct Investing offer them as part of their Active Trader programs, and others such as Questrade charge a fee.