Tag Archives: loader

GGN: Now Could Be A Good Time To Pick This High Yielder Up

Summary GGN invests in gold and natural resources, with an option overlay and the ability to use leverage. GGN’s is trading at an over 5% discount to its NAV, despite a history of trading at or above NAV. That could make now a good time to consider this relatively risky high yielder. GAMCO Global Gold, Natural Resources & Income Trust (NYSEMKT: GGN ) isn’t for the feint of heart. But if you can handle a little risk and have been looking for a way to add hard assets to your portfolio, now could be a good time to consider this closed-end fund, or CEF. And with an over 12% yield, paid monthly, you’ll be getting a nice income stream, too. Not your average bear GGN isn’t your run of the mill gold fund. This CEF’s portfolio is roughly 50% metals and mining stocks and 33% energy and energy services stocks. So roughly 80% of the fund is in sectors that have been, you could say, out of favor. Oil and related stocks have been the most recent market pariahs taking a toll on this CEF’s market price. However that doesn’t mean that you should avoid these assets. Hard assets and related industries can provide a valuable hiding place when markets are in turmoil or when inflation is rising quickly. They are often seen as a safe haven. It’s this diversification opportunity that leads investors to include some hard assets in their portfolios. So, the current malaise in mining and energy stocks can be looked at as a reason to avoid the sectors, or as a Blue Light Special opportunity for adding hard assets to your otherwise diversified portfolio-Just in case. But there’s more to GGN than just a focus on hard assets. It can also make use of leverage ( around 7% or so recently ) and an option overlay strategy. The primary goal of the fund is to provide investors with a high level of income, capital appreciation is a secondary goal. Thus, the fund writes options on the stocks it owns. And since volatility is the norm in the precious metals arena, there’s plenty of opportunity to take advantage of the options strategy to create income. Right now GGN pays $0.07 a share every month. That was recently cut from $0.09, a fact that should prepare you for income volatility here. However, even with that dividend cut, the CEF still pays a handsome yield of around 12%. Thus giving you high yield exposure to a broad asset class that could provide a safe haven if the markets tank. The leverage piece of the puzzle is more difficult to reconcile with the fund’s income objective. However, with rates historically low, GGN is taking advantage of an opportunity to access cheap debt. That’s a double edge sword, since leverage can enhance performance on the upside and exacerbate losses on the down side. There’s been more down than up lately, so it’s a good thing that leverage is pretty light at around 7%. This is a piece worth watching if you decide to step in here. That said, sister closed-end fund GAMCO Natural Resources, Gold & Income Trust (NYSE: GNT ) is another option if you want to avoid leverage, but it’s yield is a couple of percentage points lower. I’ll write about this CEF shortly. The real opportunity While owning an income producing security in out of favor industries is a good reason to be looking at GGN, it doesn’t get at the real opportunity right now. And that’s the discrepancy between GGN’s share price and its net asset value, or NAV. Historically, GGN has traded at or slightly above its NAV, with the Closed-end Fund Association pegging the average premium over the past five years at a little over 2%. But right now GGN is trading at discount of around 5% or so. The reason for this is likely two fold. First, investors have been selling off anything related to oil over the last six months or so as oil prices have fallen precipitously. That includes GGN. Second, year-end selling to lock in losses to offset gains elsewhere for tax purposes. GGN is a prime target for tax less selling since last year was a less than stellar one for the fund; the fund’s share price was down nearly 25% in 2014. (Total return, which includes distributions, was a loss of roughly 15%.) That’s not a guarantee that you’ll see a 7% price jump as 2015 progresses in addition to a 12% yield. But it does mean that GGN’s shares look like they are being put on an even deeper sale than the two sectors on which it is focused. So, if you want to own some hard assets “just in case,” now is a good time to take a look at GAMCO Global Gold, Natural Resources & Income Trust. That’s especially true if you have an income bent and prefer to outsource at least some of your investment activities.
The Current VIX Landscape Deserves Risk Assessments

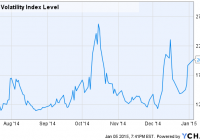
Futures are only trading slightly above their historical mean. UVXY and SVXY have both proved they are not buy and hold vehicles. Monitoring backwardation levels provides a better read on trading risks. Hello everyone, I hope your new year is off to the right start. A recent run-up in the VIX futures is cause for an update. I have been closely monitoring the VIXs trend over the last several months. Octobers spike was higher than anything we have seen since late 2011 and mid-2012. This is when investors’ fear of a double-dip recession were beginning to fade. The October spike was a combination of a perfect storm of events including the worldwide Ebola scare. The December spike only speaks to reinforce my theory that investors are on edge and leery of global economic weakness spreading over to the United States. The Eurozone has not been healthy for quite some time. Russia’s economy was put into free-fall with falling oil prices and ongoing sanctions. China has been showing slower than normal growth for some time. The million dollar question is whether or not global weakness will affect the United States. For that I do not currently have an answer. I could sit here and make up data to fit any hypothesis but you know that’s not the kind of writer I am. My personal belief is the United States will lead the world to growth over the next several years. This takes into account many factors such as continued low interest rates, a firming housing market, and managing government and personal debt levels. If the above factors change then things could easily go the other way. I like to be optimistic. Back to the VIX. Let’s take a look at my two favorite VIX ETFs: ProShares Ultra VIX Short-Term Futures (NYSEARCA: UVXY ) and ProShares Short VIX Short-Term Futures (NYSEARCA: SVXY ) I would like to point out that I have consistently written about how neither of these vehicles are buy and hold investments. I have, at times, faced push back from SVXY buy and hold investors. However, the above chart speaks for itself that even over longer periods of time, both vehicles carry significant risk. At the end of this article there is a link to how both instruments would have performed in 2008 and 2011. Contango and Backwardation I have moved away from the traditional strategy of simply watching for futures to enter backwardation and reenter contango. I am now more focused on the level of backwardation. The higher the level of backwardation, the more oversold the market is (in my opinion). Here is a look at the longer-term chart: (click to enlarge) During the double dip recession fears of 2011 the VIX futures (front and second month) hit a backwardation percentage of just over 20%. In contrast, the October event produced a 13% level of backwardation. Any event that pushes backwardation levels beyond 5% is significant. My short-term change in strategy: I currently see too much risk in shorting the VIX, even at current elevated levels. Therefore, I will be more closely tracking the percentage of backwardation in the VIX futures. In the higher risk environment, waiting for futures to reenter contango can take much of the reward away. By monitoring the level of backwardation, this gives you a clearer indication of when the pendulum has begun to swing back towards contango. Unless futures are over a 5% level of backwardation, I will be waiting on the sidelines for a better opportunity. I believe much of the current market weakness is related to commodities and not economic weakness in the United States. Lower oil prices, for a prolonged period of time, do have negative consequences for the economy. A predicted recession in Texas, loss of jobs tied to the shale boom, and many smaller oil and gas companies struggling is not the bright shining star that helped pull us out of the recession. Oil will eventually settle into a range higher than where it is currently trading. Saudi Arabia is playing chicken and the U.S. and Canada are already dropping rigs in response. The world cannot afford oil this cheap (oxymoron?). If you are a regular reader you know I focus a lot on wage growth (economic articles). This week provides more data to either disprove or cement indications that we finally have positive wage growth momentum. The market will be closely monitoring these reports. My advice to you: Be aware of the risks involved with volatility. It is historically trading slightly above its mean. This is not a huge spike by any account. Focus on backwardation levels and if futures are in contango wait on the sideline for a better opportunity. Even in 2008 UVXY would have not returned a profit if held for more than one year. For more data please review my article How UVXY and SVXY would have performed in 2008 and 2011. Purchasing SVXY in a period like this also poses significant risk should things turn south. I worry the last several years have created many complacent investors in inverse volatility products. Patience in volatility will pay off. Trust me, I have been in the position of missed opportunities many times. This only leads to irrational decisions and usually a loss of capital. Don’t feel like you’ve missed any opportunity if the VIX dips to 15 by weeks end. Just sit it out and wait for the next wave, just like a surfer. You can always catch the next one, you just have to be ready.

Best And Worst Performing Currency ETFs Of 2014

Currency markets had an eventful 2014 with the U.S. dollar touching multi-year highs against a basket of major currencies. Improving U.S. economic data, escalating geopolitical tensions, diverging central bank policies around the world and chances of a sooner-than-expected rate tightening cycle in the U.S. were some of the factors contributing to a stronger greenback. In fact, divergence in monetary policies across the globe was one of the primary factors for the strong advance in dollar this year against major currencies. While the Fed has wrapped up its QE program and is expected to start raising rates sometime this year, central banks of some of the major developed nations have stepped up their monetary stimulus programs to stimulate their struggling economies. Stronger U.S. recovery and speculations of a faster-than-expected rate hike are leading investors to pull out capital from emerging markets and pour it into U.S. stocks, causing the currencies of these nations to take a plunge. Given this, we have highlighted two of the best performing and worst performing currency ETFs of 2014 below. These were big movers in the currency market, and undoubtedly investors are expecting big things out of these currencies in 2015 as well: Best Currency ETFs of 2014 Market Vectors Indian Rupee/USD ETN (NYSEARCA: INR ) Indian equity markets have posted stellar performances this year driven by optimism over the new pro-reform, business-friendly government led by Prime Minister Narendra Modi. In fact, the Indian economy has been witnessing improving macroeconomic conditions led by better-than-expected corporate earnings, a falling inflation level and improving manufacturing and industrial production. Moreover, steps taken by the RBI governor have been successful in narrowing the current account deficit. These factors led the Indian rupee to be the best performing major currency worldwide against the dollar during 2014 and INR to be the best currency ETF this year. The fund tracks the performance of the S&P Indian Rupee Total Return Index, providing exposure to exchange rate movement of the U.S. Dollar against the Indian Rupee. The product is, however, quite unpopular and illiquid with an asset base of under $2 million and average trading volume of 27,000 shares a day. The fund charges 55 basis points as fees and has returned 14% this year. INR currently has a Zacks ETF Rank #3 or Hold rating. PowerShares DB USD Bull ETF (NYSEARCA: UUP ) Thanks to a stronger U.S. economic recovery led by higher-than-expected U.S. GDP growth numbers, renewed optimism in housing activity, continued job creation and rising consumer confidence combined with global factors, the U.S. dollar emerged as a strong currency this year. The fund tracks the performance of the Deutsche Bank Long US Dollar Index (USDX) Futures Index to provide exposure to the performance of U.S. Dollar against the following currencies: Euro, Japanese Yen, British Pound, Canadian Dollar, Swedish Krona and Swiss Franc. In terms of holdings, UUP allocates nearly 58% in Euro, while 25% collectively in Japanese Yen and British Pound. The fund has so far managed an asset base of $959.9 million and sees an average daily volume of 1.8 million shares. It charges 80 bps in total fees and expenses. The fund has added 11.3% in 2014 and has a Zacks ETF Rank of 2 or ‘Buy’ rating with Medium risk outlook. Worst Currency ETFs of 2014 CurrencyShares Swedish Krona Trust ETF (NYSEARCA: FXS ) The Swedish Krona has been among the worst performing currencies in 2014 against the greenback, with FXS plunging 18% this year. This is especially true as the currency is struggling badly in the wake of record low interest rates and deflationary pressures. The central bank’s unexpected move to slash interest rates to zero in October in order to fight deflation further aggravated the situation and led the currency to struggle badly against the U.S. Dollar. The fund tracks the price of the Swedish Krona relative to the U.S. Dollar managing an asset base of $25.3 million. The fund is quite illiquid with average daily volume of just 2,000 shares. The fund charges 40 basis points as fees and currently has a Zacks ETF Rank #3 or Hold rating. CurrencyShares Japanese Yen Trust ETF (NYSEARCA: FXY ) Though the Yen was performing well in the first part of the year due to its safe haven appeal in the wake of rising geopolitical tensions, it plummeted to a seven-year low in the second half due to an ultra loose monetary policy adopted by the Bank of Japan (BoJ). Weakening growth conditions and sliding consumer prices led the BoJ to expand its monetary policy in 2014 leading to a slumping Yen. FXY measures the relative values of two currencies, the Japanese Yen against the U.S. Dollar. The fund gains in value as the Yen appreciates relative to the Dollar. The fund manages an asset base of $105 million, charges 40 basis points as fees and trades with good volumes of 200,000 shares a day. FXY plunged roughly 13.7% for 2014, continuing its long term track record of weakness and pushing its two year loss to -27%.