Tag Archives: loader

GII Survives My First Round Of Cuts As Poor Liquidity Meets Strong Dividend Yields

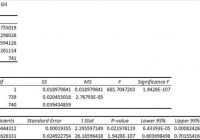
Summary I’m taking a look at GII as a candidate for inclusion in my ETF portfolio. The expense ratio isn’t great, but it is within reason. The correlation to SPY is a huge selling point, but the poor liquidity may have made the statistics less reliable. I’m not assessing any tax impacts. Investors should check their own situation for tax exposure. Investors should be seeking to improve their risk adjusted returns. I’m a big fan of using ETFs to achieve the risk adjusted returns relative to the portfolios that a normal investor can generate for themselves after trading costs. I’m working on building a new portfolio and I’m going to be analyzing several of the ETFs that I am considering for my personal portfolio. One of the funds that I’m considering is the SPDR S&P Global Infrastructure ETF (NYSEARCA: GII ). I’ll be performing a substantial portion of my analysis along the lines of modern portfolio theory, so my goal is to find ways to minimize costs while achieving diversification to reduce my risk level. What does GII do? GII attempts to track the total return (before fees and expenses) of S&P Global Infrastructure Index. At least 80% of the assets are invested in funds included in this index. GII falls under the category of “Miscellaneous Sector”. Does GII provide diversification benefits to a portfolio? Each investor may hold a different portfolio, but I use (NYSEARCA: SPY ) as the basis for my analysis. I believe SPY, or another large cap U.S. fund with similar properties, represents the reasonable first step for many investors designing an ETF portfolio. Therefore, I start my diversification analysis by seeing how it works with SPY. I start with an ANOVA table: (click to enlarge) The correlation is excellent at 69%. I want to see low correlations on my investments. Extremely low levels of correlation are wonderful for establishing a more stable portfolio. I consider anything under 50% to be extremely low. However, for equity securities an extremely low correlation is frequently only found when there are substantial issues with trading volumes that may distort the statistics. Standard deviation of daily returns (dividend adjusted, measured since January 2012) The standard deviation is also very good. For GII it is .7760%. For SPY, it is 0.7300% for the same period. SPY usually beats other ETFs in this regard; GII is doing very well comparatively. Because the ETF has fairly low correlation for equity investments and a reasonable standard deviation of returns, it should do fairly well under modern portfolio theory. Liquidity looks fine Average trading volume is bad. The average over the last 10 days was in the ballpark of 5,000 to 6,000 shares. This represents a serious liquidity problem. As I’m writing (market open), the spread is .46%. I’d be very cautious about crossing that spread and would stick to limit orders. In my sample period (about 3 years), there were 31 days where the dividend adjusted close did not change at all. Those days may represent days in which no shares changed hands and thus a change in fair value would not be recorded. Such an event could significantly damage the reliability of the statistics for correlation and standard deviation. I will perform the rest of the analysis treating the standard deviation and correlation as being reliable and valid numbers, but investors should be aware that the poor liquidity may have significantly changed the results. Mixing it with SPY I also run comparisons on the standard deviation of daily returns for the portfolio assuming that the portfolio is combined with the S&P 500. For research, I assume daily rebalancing because it dramatically simplifies the math. With a 50/50 weighting in a portfolio holding only SPY and GII, the standard deviation of daily returns across the entire portfolio is 0.6930%. With 80% in SPY and 20% in GII, the standard deviation of the portfolio would have been .7006%. If an investor wanted to use GII as a supplement to their portfolio, the standard deviation across the portfolio with 95% in SPY and 5% in GII would have been .7210%. Why I use standard deviation of daily returns I don’t believe historical returns have predictive power for future returns, but I do believe historical values for standard deviations of returns relative to other ETFs have some predictive power on future risks and correlations. Yield & Taxes The distribution yield is 3.12%. The SEC yield is 2.90%. That appears to be a respectable yield. This ETF could be worth considering for retiring investors. I like to see strong yields for retiring portfolios because I don’t want to touch the principal. By investing in ETFs I’m removing some of the human emotions, such as panic. Higher yields imply lower growth rates (without reinvestment) over the long term, but that is an acceptable trade off in my opinion. I’m not a CPA or CFP, so I’m not assessing any tax impacts. Expense Ratio The ETF is posting .40% for a gross expense ratio, and .40% for a net expense ratio. I want diversification, I want stability, and I don’t want to pay for them. The expense ratio on this fund is higher than I want to pay for equity securities, but not high enough to make me eliminate it from consideration. I view expense ratios as a very important part of the long term return picture because I want to hold the ETF for a time period measured in decades. Market to NAV The ETF is at a .09% premium to NAV currently. Premiums or discounts to NAV can change very quickly so investors should check prior to putting in an order. Generally, I don’t trust deviations from NAV and I will have a strong resistance to paying any meaningful premium to NAV to enter into a position. While the .09% premium isn’t too bad, the spread is still a concern. Largest Holdings The diversification within the ETF is mediocre. There are 7 investments that are each over 3% of the total investments, so I’m not overly impressed by the diversification within the portfolio. The value for correlation was great for an equity security, and if that correlation was based on much higher trading volumes I would be confident enough to disregard some of the concentration within the portfolio. (click to enlarge) Conclusion I’m currently screening a large volume of ETFs for my own portfolio. The portfolio I’m building is through Schwab, so I’m able to trade GII with no commissions. I have a strong preference for researching ETFs that are free to trade in my account, so most of my research will be on ETFs that fall under the “ETF OneSource” program. The best argument for the ETF, in my opinion, is that it has a very favorable level of correlation (NYSE: LOW ) with SPY and a strong dividend yield. If further testing on the correlation supports the idea that it actually is that low (I’m doubtful), then I would rate the ETF very favorably despite a mediocre expense ratio and poor liquidity. I’m willing to deal with poor liquidity by using limit orders and watching for deviations from NAV if the ETF actually provides meaningful diversification benefits. I’ll keep GII on my list for the next round with a note to dig deeper on correlations and poor liquidity.

Any Hope For A Gold And Oil ETF Rebound In 2015?

Gold and oil were the two most-talked-about commodities last year thanks to their awful performances. These two widely-followed commodities witnessed dire trading in 2014 with the latter being thrashed heavily by the strength of the greenback, demand-supply imbalances, and cooling geo-political tension in the second half of the year. While muted global inflation, reduced demand from key consuming nations like China and India restricted the yellow metal’s northward ride, the return of worries in the Euro zone, and poor data points from Japan and China have made oil more diluted. As a result, oil prices plummeted more than 50% in 2014 and gold registered the first consecutive annual decline last year since 2000 . Some are also worried that the slump could continue as the Fed is now on its way to hike the key rate this year. The Fed’s step strengthened the dollar and in turn marred commodity investing. Great Start to New Year for Gold Having lost more than 8% in the last six months, SPDR Gold Trust ETF (NYSEARCA: GLD ) bounced back to start the New Year gaining about 2% in the last two trading sessions as of (January 5, 2014). So, did the biggest gold mining fund, Market Vectors Gold Miners ETF (NYSEARCA: GDX ) , which has added about 5.8% during the same phase. Gold miners – which often trade as leveraged plays on gold – delivered two successive years of negative performances losing about 50% in 2013 and 16% in 2014. A sagging stock market and worries over Greece political crisis indicating the nation’s likely way out of the Euro area bolstered the safe-haven appeal of gold to start this year. As a result, gold bullion crossed the $1,200/ounce mark after a few months. In such a situation, investors might want to know the upcoming course of gold related ETFs. We do not expect the latest uptrend to last long. Most of the macroeconomic indicators that went against gold prices last year like the Fed policy, strong U.S. dollar and deflationary spell, will nothing but intensify this year. GLD is trading a little below its 200-day simple moving average but higher than 50 and 9-day simple moving averages which signify long-term bearishness for the ETF. The biggest fund in the space, GLD, is yet to enter the oversold territory as depicted from the above chart. The ETF is trading at a Relative Strength Index (RSI) value of 53.48 indicating there is room for further erosion in the price once the risk-off sentiments drop out of sight. The trend was similar for GDX too with current price trading below long-term averages and above the short-and-medium term averages. Its RSI value stands at 56.54. In a nutshell, miners will likely follow the underlying metal’s direction, obviously with higher magnitude, this year. Overall, the gold mining space will likely see a mixed 2015 and will be busy paring down losses incurred last year. Investors interested to bet on gold should follow the space closely as it is expected to be on a roller coaster ride this year. No New Year Party for Oil Unlike gold, there was no celebration for oil this New Year. WTI crude prices are now below $50, marking a massive slide from their level a year ago. Needless to say, this was a new multi-year low. Persistent supply glut, no production cut by OPEC as well as the U.S. will keep the space under pressure. United States Oil Fund ( USO ) is trading a little below long, medium and short-term moving averages which signifies utter bearishness for the product. In fact, it seems as though oil does not have any driver which can revive it in the near term. However, the product is presently trading at a RSI value of 22.53 indicating that it slipped into oversold territory and might change its course soon after hitting a bottom. Per barrons.com , Citigroup’s commodity group cautioned about a frustrating 2015 for oil and slashed its oil-price forecast for this year and the next to even lower than its most bearish prior estimates. Citi cuts price expectation for WTI crude from $72/barrel to $55 in 2015 while Brent oil price expectation has been reduced to $63 a barrel from $80 a barrel. Bottom Line In short, 2015 should not be great for both commodities and the related ETFs barring some occasional spikes which can be defined as a correction. Investors dying to look for a sustained trend reversal in these commodities, should wait for a big Chinese and Euro zone stimulus, which may bolster the regions’ waning manufacturing industry spurring the usage of oil and goading investors to buy more gold (notably, China is the world’s largest consumer of the yellow metal). Investors should also look out for a pull back in oil production and the return of geo-political tensions. As far as the Fed rate hike is concerned, we believe that the most of it has been priced in at the current level, suggesting that either way, it will be another interesting year for oil and gold.

How To Find The Best Sector ETFs

With so many ETFs to choose from, finding the best can be a daunting task. You cannot trust ETF labels, only due diligence on the holdings allows an investor to understand an ETF. Low costs and quality holdings, not past performance, is the best indicator of an ETF’s future success. Why ETF Labels are Confusing There are at least 44 different Financials ETFs and at least 188 ETFs across all sectors. Do you need that many choices? How different can the ETFs be? Those 44 Financials ETFs are very different. With anywhere from 22 to 541 holdings, many of these Financials ETFs have drastically different portfolios, creating drastically different investment implications. The same is true for the ETFs in any other sector, as each offers a very different mix of good and bad stocks. The Consumer Staples sector ranks first. Financials ranks last. How to Properly Assess a Sector ETF I firmly believe ETFs for a given sector should be similar. I think the large number of Financials (or any other) sector of ETFs hurts investors more than it helps because too many options can be paralyzing. It is simply not possible for the majority of investors to properly assess the quality of so many ETFs. Analyzing ETFs, done with the proper diligence, is far more difficult than analyzing stocks because it means analyzing all the stocks within each ETF. To be a smart investor, you understand analyzing the holdings of an ETF is critical to finding the best ETF. Figure 1 displays the best ETF in each sector. Figure 1: The Best ETF in Each Sector (click to enlarge) Sources: New Constructs, LLC and company filings How to Avoid “The Danger Within” Why do you need to know the holdings of ETFs before they buy? You need to know to be sure you do not buy a fund that might blow up. Buying a fund without analyzing its holdings is like buying a stock without analyzing its business and finances. No matter how cheap, if it holds bad stocks, the ETF’s performance will be bad. PERFORMANCE OF FUND’S HOLDINGS = PERFORMANCE OF FUND New Constructs covers over 3000 stocks and is known for the due diligence we do for each stock we cover. Accordingly, our coverage of ETFs leverages the diligence we do on each stock by rating ETFs based on the aggregated ratings of the stocks each ETF holds. The PowerShares KBW Property & Casualty Insurance Portfolio ETF (NYSEARCA: KBWP ) is the top-rated Financials ETF and the overall top ranked fund of the 188 sector ETFs that I cover. The worst ETF in Figure 1 is State Street’s Utilities Select Sector SPDR ETF (NYSEARCA: XLU ), which gets a Neutral (3-star) rating. One would think ETF providers could do better for this sector. Kyle Guske II contributed to this post. Disclosure: David Trainer Kyle Guske II receive no compensation to write about any specific stock, sector, or theme.