Tag Archives: loader

Utilities ETF: XLU No. 1 Select Sector SPDR In 2014

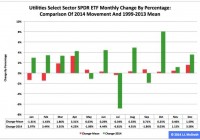
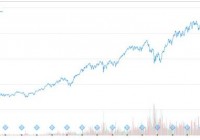
Summary The Utilities exchange-traded fund finished first by return among the nine Select Sector SPDRs in 2014. As it did so, the ETF posted the best annual percentage gain in its 16-year history. However, seasonality analysis indicates it could be facing a tough first quarter. The Utilities Select Sector SPDR ETF (NYSEARCA: XLU ) in 2014 ranked No. 1 by return among the Select Sector SPDRs that break the S&P 500 into nine chunks. On an adjusted closing daily share price basis, XLU rocketed to $47.22 from $36.68, a zooming of $10.54, or 28.74 percent. Accordingly, the ETF outdistanced its parent proxy SPDR S&P 500 ETF (NYSEARCA: SPY ) by an extraordinary 15.27 percentage points. (XLU closed at $47.35 Wednesday.) XLU also ranked No. 1 among the sector SPDRs in the fourth quarter, as it outpaced SPY by 8.28 percentage points. In addition, XLU ranked No. 1 among the sector SPDRs in December, as it outran SPY by 3.83 percentage points. Overall, XLU posted the best annual percentage return in its 16-year history: Its previous record was set in 2003, when it swelled 26.46 percent. XLU appears key to analysis of market sentiment based on the comparative behaviors of the Select Sector SPDRs . If XLU ranks near No. 1 by return during a given period, then I believe market participants are in risk-off mode; if XLU ranks near No. 9 by return over a given period, then I think market participants are in risk-on mode. Figure 1: XLU Monthly Change, 2014 Vs. 1999-2013 Mean (click to enlarge) Source: This J.J.’s Risky Business chart is based on analyses of adjusted closing monthly share prices at Yahoo Finance . XLU behaved a lot better in 2014 than it did during its initial 15 full years of existence based on the monthly means calculated by employing data associated with that historical time frame (Figure 1). The same data set shows the average year’s weakest quarter was the first, with a relatively small negative return, and its strongest quarter was the second, with an absolutely large positive return. The ETF’s October 8.03 percent gain was its sixth-highest monthly return ever. Figure 2: XLU Monthly Change, 2014 Versus 1999-2013 Median (click to enlarge) Source: This J.J.’s Risky Business chart is based on analyses of adjusted closing monthly share prices at Yahoo Finance. XLU also performed a lot better in 2014 than it did during its initial 15 full years of existence based on the monthly medians calculated by using data associated with that historical time frame (Figure 2). The same data set shows the average year’s weakest quarter was the first, with a relatively small positive return, and its strongest quarter was the second, with an absolutely large positive return. Clearly, this means there is no historical statistical tendency for the ETF to explode in Q1. Figure 3: XLU’s Top 10 Holdings and P/E-G Ratios, Jan. 7 (click to enlarge) Note: The XLU holding-weight-by-percentage scale is on the left (green), and the company price/earnings-to-growth ratio scale is on the right (red). Source: This J.J.’s Risky Business chart is based on data at the XLU microsite and Yahoo Finance (both current as of Jan. 7). In the wake of the sea change in bias at the U.S. Federal Reserve , away from loosening and toward tightening, XLU’s record-setting performance in 2014 kind of makes sense, at least in an equity market where share prices are primarily driven by the ebb and flow of asset purchases made by the central bank under one or another of its so-called quantitative-easing programs. It is worth mentioning in this context that the Fed announced the conclusion of purchases under its latest QE program Oct. 29 and that the ends of purchases under its previous two formal QE programs are associated with both a correction and a bear market in large-capitalization stocks, as evidenced by SPY’s dipping -17.19 percent in 2010 and dropping -21.69 percent in 2011. It is also worth mentioning that XLU’s big-time performance last year means that I, as a growth-and-value guy, see neither growth nor value in most of the utilities sector, as indicated by the above chart (Figure 3) and numbers released by S&P Senior Index Analyst Howard Silverblatt Dec. 31. At that time, Silverblatt pegged the P/E-G ratio of the S&P 500 utilities sector as 3.43. In the current environment, I therefore would be completely unsurprised should XLU continue to behave well in the current quarter, not on an absolute basis but on a relative basis (i.e., in comparison with the other Select Sector SPDRs and with SPY). On balance, the ETF may not produce gains, but it might produce losses smaller than those of its siblings. Disclaimer: The opinions expressed herein by the author do not constitute an investment recommendation, and they are unsuitable for employment in the making of investment decisions. The opinions expressed herein address only certain aspects of potential investment in any securities and cannot substitute for comprehensive investment analysis. The opinions expressed herein are based on an incomplete set of information, illustrative in nature, and limited in scope. In addition, the opinions expressed herein reflect the author’s best judgment as of the date of publication, and they are subject to change without notice.

Join Them If You Can’t Beat Them: Stop Picking Individual Stocks And Start Living An Easier Life

Summary The S&P has risen 171%. Time to start stock picking? Not necessarily. Let’s go back in time (15 years ago) to find a similar scenario, and let’s find out what John did. Our imaginary fellow investor from that time, John, made a decent amount of money by sticking to the plan and using common sense, while doing less and exposing himself to less risk. Since regular investors are really lagging behind, performing as good as the market is already setting you apart and makes you one of the top investors. My goal of today’s article was to figure out once and for all whether or not I should be going long – not by stock picking – but by buying an ETF of the S&P 500, so that I actually don’t have to do anything. If I had a dollar for every time I heard and read that “95% of individual investors don’t beat the market”, I’d have a lot of dollars. And yet still, while this seems to be a 100% accurate fact, I refused (until this point) to believe that I’m part of that 95% and hoped that I’ll beat the market over time. Does this make me an idiot or just a typical human being? I don’t know. But what I do know is that there are still a lot of stock pickers out there that are just as stubborn as me. 1 in 20 investors So once and for all, as you’re reading this, I hope you’ll realize that only 1 in 20 investors can select a portfolio of active funds that will outperform the market index over a 20-year period. That’s only a 5% chance of success, or a staggering 95% chance of failure. To put this in perspective: Being diagnosed with cancer in your lifetime: 1 in 2 for men, 1 in 3 for women Beating the house in a hand of blackjack: 1 in 2.2 A celebrity marriage lasting a lifetime: 1 in 3 Successfully climbing Mount Everest: 1 in 3 Living to 100 (if you’re 50): 1 in 8 Today’s article will answer a lot of questions for investing teens, investors in their twenties and even investors in their early thirties who are probably bothered by the same question: Should we be buying individual stocks that appear attractive/cheap after the 171% increase in the S&P 500? Or should we be afraid and wait for the next “big crash” before going long? Or should we just surrender to Mister Market no matter what, and start buying the index as a whole today through the oh-so simple S&P 500 ETF (NYSEARCA: SPY ) that follows the entire index, as we’ll be better off following the market in the long run? Let’s go back in time I believe that the only way to get a possible answer to this question is to present ourselves with a similar scenario where investors were probably also asking themselves the same thing, and then look at how things turned out for them if they had acted a certain way. In order to try and do this, I suggest we jump back in time. In fact, let’s jump back exactly 15 years ago to January 7, 2000. (click to enlarge) (Source: Yahoo Finance) The above graph is a representation of what investors were looking at, at that moment in time. SPY was up 215% since January 7, 1995, and was quoting at an all-time high. This reflects the current situation pretty damn well – if not better. (click to enlarge) (Source: Yahoo Finance) SPY is currently up 171% since its lowest point in February 2009, and is also quoting at an all-time high. So 15 years ago, I bet a lot of investors were wondering the same thing. Should we be stock picking? Or should we continue to follow the market. First of all, let’s just admit that deciding to get a position at an all-time high is never a pleasant occasion. It feels like shooting yourself in the foot. It feels like setting yourself up for losses. Especially when thinking about the typical sayings like: “Sell high, buy low” and “Be fearful when others are greedy and greedy when others are fearful”, which are clearly warning you not to get in at all-time highs after a 200% rally. Let’s meet John However, let’s just assume that one of our fellow investors (we’ll call him John for now) was ready to ignore all of his natural human responses/emotions and would just agree with the fact that 95% of individual stock pickers fail, and thus, that he is better off buying SPY no matter what. John feels that it is better to go with the market, “If you can’t beat them, join them”, right? Waiting for the next big correction before getting in seems to be silly, as no one knows when it’ll come. The strategy and situation of our imaginary investor John is the following: John just turned 20, and has decided that he wants to have a nice pension fund by the time he is 60, or perhaps have a nice pile of money by the time he is in his prime, let’s say, forty years old. This gives our investor friend a time horizon of at least 20 years, and when necessary, even 40 years. He then figures that he can miss at least $500 per month. John starts to deposit $500/month in SPY as of January 7, 2000, and will continue to do this at the beginning of each month. John is 35 Now, let’s take a look at how John’s simple strategy has played out so far – 15 years later. After 15 years, John has invested a total of $90.000 ($500 x 180) in the ETF, and the position seems to be worth $176.567,40 as of today. So without having to do anything special, except depositing $500 per month into the ETF (that was quoting at an all-time high when starting), he would have gained $86.567 if he were to sell today. (click to enlarge) John’s performance could have also been achieved if he would have chosen his stocks individually. However, he then needed to achieve an ~8.45% cumulative annual growth rate (see table below). Which is a rather hard thing to do for the average Joe in today’s market, right? ( Source ) Warren Buffett himself did only slightly better, growing Berkshire’s book value by 8.9% annually during the past 15 years. Thereby, let’s not forget that John has had 15 wonderful years. He never had to waste a single minute of his day in order to achieve this 8.45% annual growth rate. He never slept bad. He never worried that he would wake up and all his money would be gone. All he did was execute his simple plan. Let’s assume John is a smart guy Now, let’s assume that John is a smart guy like you and me, and that he tries to seize opportunities whenever they come along. So one day, he notices that his ETF is starting to drop due to the financial crisis. John thinks this is a temporary problem and decides to stick to the plan; in fact, he even tries to double his efforts, and decides to make a deposit of $1000 per month during 2009. (click to enlarge) By injecting an extra $6000 during the 2009 crash, John’s position is now worth a total $191.352,70, and has thus increased with $14.785 because of his extra efforts. John’s cumulative annual growth rate now lies at ~9.5% for the past 15 years, while doing nothing special except using his common sense. This is way higher than what average investors ( 2.6% ) have been achieving during the past 10 years. Conclusion Either you get a thrill out of proving others wrong and will try to actively beat the market – knowing that there’s a rather high chance you won’t beat it – or you’re just not bothered to achieve above-average results, and are happy with whatever the market does. However, as the average investor has achieved a 2.6% return for the past 10 years, and John has been able to scoop a 9.5% annual return by following the market, perhaps doing as well as the market has become an achievement of itself and is already making you special. Because of today’s analysis, I’ve decided to start depositing $500 into SPY each month as of now, as I feel that there is no downside in doing this in the long term. This way, some of my money will at least perform as well as the market. However, I will nonetheless continue to keep a portfolio full of individual stocks, as I also really enjoy investing actively. Even when this means that I’ll have a 95% chance of underperforming the market with this portfolio.

PBS Is Just What I’m Not Looking For In An ETF

Summary I’m taking a look at PBS as a candidate for inclusion in my ETF portfolio. A limited underlying index, high standard deviations, moderate correlation, weak yields and high expense ratios make this a poor fit for my tastes. The best things going for the portfolio is decent (but not great) liquidity. I’m not assessing any tax impacts. Investors should check their own situation for tax exposure. Investors should be seeking to improve their risk-adjusted returns. I’m a big fan of using ETFs to achieve the risk-adjusted returns relative to the portfolios that a normal investor can generate for themselves after trading costs. I’m working on building a new portfolio and I’m going to be analyzing several of the ETFs that I am considering for my personal portfolio. One of the funds that I’m considering is the PowerShares Dynamic Media Portfolio (NYSEARCA: PBS ). I’ll be performing a substantial portion of my analysis along the lines of modern portfolio theory, so my goal is to find ways to minimize costs while achieving diversification to reduce my risk level. What does PBS do? PBS attempts to track the total return (before fees and expenses) of the Dynamic Media IntellidexSM Index. At least 90% of the assets are invested in funds included in this index. The index only includes the common stock of 30 companies, all of which are considered U.S. Media companies. PBS falls under the category of “Communications.” Does PBS provide diversification benefits to a portfolio? Each investor may hold a different portfolio, but I use (NYSEARCA: SPY ) as the basis for my analysis. I believe SPY, or another large cap U.S. fund with similar properties, represents the reasonable first step for many investors designing an ETF portfolio. Therefore, I start my diversification analysis by seeing how it works with SPY. I start with an ANOVA table: (click to enlarge) The correlation is mediocre at 85%. I want to see low correlations on my investments. Extremely low levels of correlation are wonderful for establishing a more stable portfolio. I consider anything under 50% to be extremely low. However, for equity securities an extremely low correlation is frequently only found when there are substantial issues with trading volumes that may distort the statistics. Standard deviation of daily returns (dividend adjusted, measured since January 2012) The standard deviation is great. For PBS it is .9703%. For SPY, it is 0.7300% for the same period. SPY usually beats other ETFs in this regard, but this combination of standard deviation and correlation isn’t going to do much good under modern portfolio theory. Liquidity looks acceptable Average trading volume isn’t very high, a bit over 40,000, but that also isn’t low enough to be a major concern for me. Mixing it with SPY I also run comparisons on the standard deviation of daily returns for the portfolio assuming that the portfolio is combined with the S&P 500. For research, I assume daily rebalancing because it dramatically simplifies the math. With a 50/50 weighting in a portfolio holding only SPY and PBS, the standard deviation of daily returns across the entire portfolio is 0.8182%. With 80% in SPY and 20% in PBS, the standard deviation of the portfolio would have been .7558%. If an investor wanted to use PBS as a supplement to their portfolio, the standard deviation across the portfolio with 95% in SPY and 5% in PBS would have been .7352%. Why I use standard deviation of daily returns I don’t believe historical returns have predictive power for future returns, but I do believe historical values for standard deviations of returns relative to other ETFs have some predictive power on future risks and correlations. Yield & Taxes The distribution yield is .50%. I simply don’t see this as a useful holding for retiring investors. The combination of mediocre correlation and high standard deviation results in an ETF that is unlikely to lower the total risk profile of the portfolio unless it was used in phenomenally small amounts. The distribution yield is weak, which means retiring investors may have a stronger temptation to sell shares if their income is too low. The point of building the portfolio with ETFs is to avoid active management outside of rebalancing. I can deal with a weak yield because I’m far from retirement, but it is starting to feel like the ETF is looking for a fairly small niche to fill. I’m not a CPA or CFP, so I’m not assessing any tax impacts. Expense Ratio The ETF is posting .62% for a gross expense ratio, and .62% for a net expense ratio. I want diversification, I want stability, and I don’t want to pay for them. For an ETF that already left me wanting more in most categories, being hit with a big expense ratio isn’t the way to draw me back in. Market to NAV The ETF is at a .04% premium to NAV currently. Premiums or discounts to NAV can change very quickly so investors should check prior to putting in an order. The ETF is large enough and liquid enough that I would expect the ETF to stay fairly close to NAV. Generally, I don’t trust deviations from NAV and I will have a strong resistance to paying a premium to NAV to enter into a position. Largest Holdings The diversification can’t be very good when there are only 30 companies in the underlying index. The chart below supports that assessment. The top seven companies are each more than 5% of the total holdings. (click to enlarge) Conclusion I’m currently screening a large volume of ETFs for my own portfolio. The portfolio I’m building is through Schwab, so I’m able to trade PBS with no commissions. I have a strong preference for researching ETFs that are free to trade in my account, so most of my research will be on ETFs that fall under the “ETF OneSource” program. PBS won’t make the next round of comparison. It feels like the ETF would be most useful for making short-term bets on the sector. Some sector ETFs can provide additional value to a portfolio by improving the balance of different exposures, but I don’t see that benefit here.