Tag Archives: load

The ‘Efficiency’ Of The Market Doesn’t Matter To Smart Investors

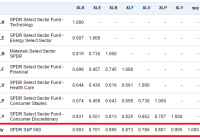
The huge growth in index funds has caused some investors to debate the merits of the market’s “efficiency” and whether index funds would make the markets less efficient. The basic thinking is that if everyone starts buying index funds then that could create more opportunities for stock pickers who are able to go against the grain and pick the stocks that have been unjustifiably correlated to the actions of the overall index. This whole debate confuses why correlations are rising in the first place. Correlations aren’t rising because index funds are becoming more prevalent. Index funds are becoming more prevalent because the performance of the economy is becoming increasingly correlated. If you look at any sector of the S&P 500, you’ll find rising correlations over the course of the last 50 years. The average 10-year correlation of all the sectors of the S&P 500 is about 83.5%: (10-Year Correlation of various sectors) This isn’t happening because index funds are becoming more popular. It’s happening because US corporations are becoming increasingly interconnected. Public companies are becoming multi-national and multi-industry companies whose performance depends increasingly on the way the macroeconomy works. If we look at the underlying Earnings Per Share of these same industries, we find equally strong correlations in their profit growth over time. Of course, high correlations doesn’t mean there won’t be uncorrelated entities whose prices get irrationally whipsawed by the aggregate market performance. But it does mean that it is becoming increasingly difficult to find entities who aren’t dependent on the performance of the broader economy. Finding truly uncorrelated companies is not as easy today as it might have been back in the early 1900s when the broader economy was much more fragmented. Paul Samuelson always argued that the markets were micro efficient, but not macro efficient. Indeed, the whole concept of market “efficiency” is becoming increasingly irrelevant in a world where entire economies are becoming so highly correlated. But this doesn’t change the importance of understanding the discussion and its impact. At the aggregate level, we have all become “asset pickers.” The distinction between “active” and “passive” investors is largely irrelevant in a world where we all now pick baskets of assets inside the global aggregate. And when one deviates from global cap weighting (roughly the Global Financial Asset Portfolio) you are engaging in a form of asset picking that makes you no different than a stock picker. You are declaring that you can generate a better risk adjusted return than the global aggregate. Indexing has become the new stock picking. Instead of picking 25 stocks in an index, we now pick baskets of index funds inside a global aggregate. The idea of “market efficiency” was never very useful to begin with however because it is constructed around a gigantic political strawman. The EMH is essentially a political construct that argues that discretionary intervention is useless because “the market” is smarter than everyone else. It is a political argument against discretionary intervention that was constructed to create a theory of finance that was consistent with an anti government economic theory (Monetarism primarily). In essence, you can’t “beat the market” because the market is so smart. This is silly though. The market will generate the aggregate market return and your real, real return will be the market return minus the rate of inflation, taxes and fees. Taxes and fees alone will reduce the aggregate return by over 35% (if we assume a 10% aggregate return, 1% fees and 25% tax rate). No one will consistently beat “the market” aside from a few lucky outliers. The math just doesn’t work. And the index we are comparing ourselves to is a completely fictitious benchmark because the average real, real return is lower than the pre-tax and pre-fee benchmark to begin with. But the EMH defenders have misconstrued this entire debate to promote a political position constructed by anti government economists at the Chicago School of Economics. Imagine, for instance, that, for the purpose of record keeping, at the end of each NBA basketball game, the NBA reduced the average score of 100 points by 25%, and then imagine that the coaches reduced the score by another 10%. What the EMH defenders have done is argued that the score of 100 means that the teams are all terrible because they cannot, on average beat this “benchmark.” There will be outlier teams who sometimes score more than 100 points, but on average these “professional” teams will underperform. EMH defenders have used this strawman to argue that “active” investors are all terrible. It’s a completely useless construct that does nothing more than misconstrue the entire premise of the discussion. Of course, none of this means that high fees and overly active trading are good. After all, when one engages in such activities they only increase the size of the friction, which reduces returns in the first place. But the debate about EMH and “active” vs. “passive” has been blurred by a useless discussion about how “efficient” the market is. The reality is that we are all active investors to some degree. All indexers have to pick their asset allocations and the funds they will use. All indexers time their entry/exit points, their rebalancing points, their “tilts,” etc. The smarter indexer tries to capture much of the broad market gain while reducing their tax and fee burden. But that has nothing to do with whether the market has become “efficient” or whether some degree of “active” management is “smart” or “stupid.” Samuelson was right – the market is micro efficient and macro inefficient. And as the market has become increasingly macro oriented the discussion about the “efficiency” of the market has become increasingly useless.
For Passive Funds, A Stronger Link Between Fees And Performance

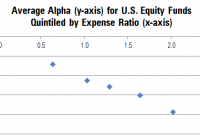
By Michael Rawson When shopping for products of unknown quality, price forms a cue that shoppers can use to differentiate products. It is often a safe assumption that a higher priced product offers better performance than a lower priced product. For instance, the Porsche 911 lists for $93,000 while the Chevy Malibu will set you back $20,000. But this is not always the case, particularly with fund investing. Unlike the Porsche, there is no cachet from buying a high-priced fund. Still, price can be useful when predicting results – though not in the way fund companies would like. Morningstar’s Analyst Rating for funds is based on five pillars: People, Parent, Process, Performance, and Price. The first three of these pillars are somewhat qualitative, while Performance and Price are much more quantitative. Price is the most tangible, both in terms of the impact of price on fund performance and comparability across funds. On average, we find that the higher the price of a fund, the worse its performance tends to be, and the link between fees and performance is stronger for passive funds. The chart below illustrates the relationship between price and performance among U.S. equity funds. It shows the average alpha (excess returns after adjusting for risk relative to the category benchmark) for all funds grouped into five quintiles by expense ratio. The y-axis shows the average alpha and the position on the x-axis indicates the average expense ratio for the group. We included all U.S. equity funds that existed five years ago and survived through today. Because some funds have performance-based fees, we used the 2009 annual report expense ratio rather than the expense ratio during the sample period. This also simulates the results of picking funds based on currently available information and examining future performance. As the chart illustrates, there appears to be an inverse relationship between fees and performance. The lowest-fee quintile has an average expense ratio of 0.64% and an average alpha of negative 0.71%, while the highest-fee quintile has an average expense ratio of 2.02% and an average excess return of negative 1.94%. However, grouping the funds into quintiles masks the tremendous variability in the relationship between fees and performance, which is better illustrated in the following graph. Here, the relationship appears much less precise. In fact, a regression of alpha on expense ratio has an R-squared of just 6%, suggesting that fees explain a small portion of the overall variability in fund performance. However, there are a few issues that may obfuscate this relationship. The chart above includes all U.S. equity funds, even though small-cap funds have higher expense ratios than large-cap funds. It also includes all available share classes despite the fact that low-cost institutional share classes must outperform high-cost retail share classes of the same fund. Also, the relationship between fees and performance might be different for active and passive funds. Because passive funds seek to match an index less fees, the relationship between fees and performance might be stronger among them. In contrast to passive funds, well-run active funds have a better chance of earning back their fees. In order to address these issues, we narrowed our focus to large-cap U.S. equity funds and removed multiple share classes of the same fund to get a cleaner read on the link between fees and strategy performance. We also grouped active and traditional broad passive funds separately and removed most niche index and strategic beta funds (index funds that make active bets in an attempt to outperform traditional indexes). The results are shown in the following chart. In this chart, the relationship between fees and performance is a bit clearer. For active funds, there is still a tremendous amount of variability, but there appear to be more dots in negative territory as we move from lower- to higher-cost funds (from left to right on the chart). Passive funds seem to hew closer to a straight line. Quantifying this relationship with a regression that expresses the expected alpha as a function of the expense ratio highlights the negative slope. For active large-cap funds, the expected alpha is approximately negative 1.21 times the expense ratio. In other words, a fund with an expense ratio 10 basis points above the average would be expected to deliver an alpha 12 basis points lower than average. While the relationship is significant, the R-squared is only 6%. Despite the poor fit of the model linking fees to performance for active large-cap funds, lower-fee funds still had a better chance of outperforming on average. This simply indicates that, while fees are predictive of performance, there are many other factors that matter. For passive large-cap funds, the R-squared is 38%. This means that there is a cleaner relationship between fees and performance for passive funds than active funds. In the sample studied, active funds in the lowest expense ratio quintile had a 28% chance of earning a positive alpha compared with just a 15% chance for those in the highest-cost quintile. But the relationship is even stronger for passive funds. About 52% of passive large-cap funds in the lowest-cost quintile earned a positive alpha (however small), while none of the funds in the highest-cost quintile did. This suggests that investors can increase their probability of success by selecting low-cost funds. Fortunately, there are a lot of low-cost passive and active funds to choose from. Vanguard Total Stock Market ETF (NYSEARCA: VTI ) holds more than 3,000 U.S. stocks and offers similar exposure to iShares Russell 3000 (NYSEARCA: IWV ) . The funds have had similar returns and risks over the past decade. However, the Vanguard fund charges 0.05% compared with 0.20% for the iShares fund. Assuming both funds return 5% annually gross of fees over 10 years, a $100,000 investment in VTI would be worth about $2,300 more at the end of the period than an investment in IWV. Among active funds, Price is one of five pillars taken into consideration in the Morningstar Analyst Rating for funds. When there are multiple funds that offer similar exposure, the lowest-cost option may be the prudent choice. Disclosure: Morningstar, Inc. licenses its indexes to institutions for a variety of reasons, including the creation of investment products and the benchmarking of existing products. When licensing indexes for the creation or benchmarking of investment products, Morningstar receives fees that are mainly based on fund assets under management. As of Sept. 30, 2012, AlphaPro Management, BlackRock Asset Management, First Asset, First Trust, Invesco, Merrill Lynch, Northern Trust, Nuveen, and Van Eck license one or more Morningstar indexes for this purpose. These investment products are not sponsored, issued, marketed, or sold by Morningstar. Morningstar does not make any representation regarding the advisability of investing in any investment product based on or benchmarked against a Morningstar index.

Risk Of Grexit And GLD

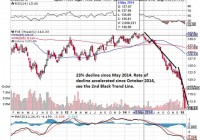
Background of the difficult economic conditions of the eurozone and the threat of Syriza’s victory in Greece. GLD has already priced in the threat of Syriza since November 2014 and has been rising steadily. Those who wants the safe habour of gold has already gone in. Risk of Syriza overtipping its hand for a quick fix to high debt with a primary budget surplus even though there are indications that Syriza will be moderate in power. Time to hold for those with GLD exposure and observe future developments and for those without exposure to initiate it. Difficult Times For The Eurozone Gold has been used been used as a medium of exchange since historic times and especially in times of turmoil. In modern times, with the creation of bank notes and the 1971 closing of the gold window, paper money is the medium of exchange and its power lies in the ‘full faith and credit of’ whichever government that is issuing the note. Now the full faith and credit of the United States Government is still valid in the market especially in a time where the U.S. economy is growing strongly (11 year high of 5% GDP growth in the third quarter of 2014), the U.S. Dollar (USD) is strong and most importantly the state of the union is strong. However the same attributes cannot be said for the eurozone. The eurozone economy is faltering at 0.2% growth for the same third quarter 2014 when the U.S. is growing strongly. The euro, as represented by the CurrencyShare Euro Trust ETF (NYSEARCA: FXE ), has declined by 23% since 05 May 2014 as seen in the chart below and this decline has accelerated since October 2014 which coincided with a dovish European Central Bank (ECB) decision. (click to enlarge) Lastly there is the issue regarding the state of the eurozone. The integrity of the eurozone had been tested in 2012 when Greece almost elected Syriza who came in second into government. This sparks the famous line by ECB President Draghi to ‘do whatever it takes’ to preserve the euro. The Rise and Threat of Syriza on Eurozone Now with the snap General Election on 25 January 2015, Syriza has defeated the previous government New Democracy to form the next government of Greece and its firebrand leader Alexis Tsipras would be youngest Greek Prime Minister at age 40 in 150 years. The whole reason that Syriza poses an existential threat to the whole eurozone project is quite simply because it does not want to pay its huge external debts. Its policy platform is anti-austerity, the repudiation of debt in essence and more social spending. This is what got it in power in the very first place which pleased the Greek population and at the same time send an earthquake to the rest of the eurozone. This whole political instability came about from the failed election of President of Greece. The President of Greece is a largely ceremonial role held currently by the incumbent Karolos Papoulias for 2 terms of 5 years each. His second term is set to end in March 2015. The President of Greece is elected by the Hellenic Parliament in Greece and has to be done latest 1 month before he is set to leave office as decreed by the Greek Constitution. The Prime Minister of Greece Samaras brought it forward to December 2014 but he was unable to secure a 2/3 majority of parliament vote for his candidate on the first 2 rounds of voting on the 17th and 23rd. The third round of voting on the 27th also failed to produce the reduced 3/5 majority of 180 votes which triggered the election for a new parliament on 25 January 2015. The new parliament will have to vote for the new president again by February 2015. Safe Harbor of GLD If you are a rich or middle class citizen (with enough money beyond the hand to mouth existence to be worried) in Europe and you are faced with the possibility that the euro note you hold can either be worthless or in the more optimistic case, be exchanged back at a steep discount to the national currency, what will your natural options be? You will avoid European equities and bonds because they are denominated in euros. You might want to change into a currency like the USD that will hold its value or you might want to buy physical gold which is harder to devalue or you might want to invest into a gold ETF denominated in the USD like GLD to avoid the storage and insurance costs. This is why we can see that the value of gold, as seen in the SDPR Gold Trust ETF (NYSEARCA: GLD ), has rose steadily since 03 November 2014 whenever there is a hint of potential political instability in Greece. (click to enlarge) As we can see, the market is forward looking and has began to price in the Greek instability before the formal vote in the Hellenic Parliament. Gold investors started to buy when the rumor of the a potential change in government given the weakness of the current Greek coalition government. This is why we are unlikely to see a sudden spike up in GLD now because the market has sufficient time to build their long position. Even for those who are less connected, they will have seen in coming last month when the rounds of Presidential election failed in Parliament. History of Debt Concession However now that Syriza has formed the new government,it remains to be seen how far its leader Tsprais will go to fulfill his campaign promises. It is clear that he will want to extract some sort of concession from the Troika. The prior Greek government managed to extend the loan repayment period from the original 7 years to 15 years in July 2011 and interest rates were cut to 3.5% for a mega loan of $109 billion euros loan package. This is the start of the second and ongoing Economic Adjustment Program for Greece after the first program which saw loans of $110 billion euros from May 2010 to June 2011. It is also in this period where we saw a soft default on a debt restructuring deal which concluded on 09 March 2012 on $205.5 billion euro of debt. This caused the ISDA to call a Credit Event which triggered $3.5 billion of credit default swaps and let Fitch to downgrade Greek debt from ‘CCC’ to ‘Restricted Default’. All in all, through this soft default option, Greek debt holders lost a massive $107 billion euros, a record for sovereign debt losses. Is this the calm before or after the Storm? As far as the market is concerned, the eurozone has survived this crisis of soft default with the help of the ECB when other organization were unable to convince the market. This soft default option is therefore unlikely to affect the market drastically. In other words, the extent and pretend scheme coupled with significant haircut works to preserve the eurozone even if it caused dismay to bond holders. Now the market is waiting to see if Syriza will actually dare to defy the Troika and simply walk away from its debt given the consequences. As this Reuters report shows, even as early as 04 November 2014 (coinciding with the rise of gold prices), when Syriza gets closer to power, it has proceeded to soften its stance from the choice of hard default to renegotiation. The German/ Creditor’s position is clear. They are willing to accept a debt restructuring but they will not accept a hard default or any cancellation of debt. This will weaken their position with other debtor countries like Poland, Ireland and Spain. The only risk now is that Syriza will overtip its hand when asking for concessions to the point where it is unacceptable to the Creditors. This is a possibility given the nature of his fiery speech and the expectations of quick relief from the Greek public. (click to enlarge) Source: Google There is a possibility that he will be too engrossed about the quick fix of Greek 175% debt to GDP ratio, which is higher than the rest of Europe. There is also the temptation to turn the Greek’s primary budget surplus of $3.3 billion euros for year 2015 to a current account surplus if they don’t pay off their external debts. The real risk is that Tsprias might then be too willing to leave the eurozone and underestimate the possibility of the hyperinflation tragedy. This might happen when the drachma is reintroduced at a point where the international market has no confidence in it shortly after a massive debt default. Conclusion GLD has appreciated way before the actual victory of Syriza and those who wanted to hold gold already has gold exposure in their portfolio. These are the cautious ones. For the vast majority of the public, it is the fear for systemic unrest on the scale of Lehman Brother collapse that will bring them into gold in doves. This fear will only occur when there are clearer signs of a disorderly Greece Exit (or Grexit). While we believe that Syriza was only posturing to gain power and it might be slightly more aggressive than the outgoing New Democracy government, there is also a serious risk that the inexperienced Syriza will overturn its hand and oversee the expulsion of Greece from the eurozone under its watch. There might be other forces that might tilt the balance inside and outside Syriza towards a cold calculation of benefits and costs that might result in unexpected results. There is still market confidence in the USD and GLD. For those who are upset about the lack of audit for GLD, consider it from the faith and credit angle. Based on the market capitalization of $30.78 billion and last known daily volume of 6.27 million, it is clear that there is market confidence in GLD and you can liquidate it quickly when you need it. However for those in Europe who are worried about capital controls, then it will make sense for them to hold physical gold but they will have to incur cost for storage and insurance. Then there is also the security risk for holding gold against theft or worst. For them, in today’s world without capital controls in Europe, GLD will be a good way to hold their wealth. For investors in general, they would do well to hold onto their GLD holdings especially for those who heeded my earlier advice to buy GLD in my earlier article, The SNB Catalyst For GLD . That article also explored the potential European instability from a different perspective. For those who have nil exposure to GLD, this will be a good time to gain exposure when there will be a brief lull in prices as the market wait and observe the actions of the new Greek government and the official response from the Troika who represent the Creditors.