Tag Archives: load

The Refined ETF Approach To Emerging Markets Consumers

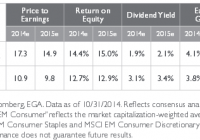
Summary More investors are diversifying with overseas exposure. Why investors should take a look at consumer sectors in emerging markets. Emerging market consumer sector ETF options. Investors have heard plenty about the rise of the emerging markets consumer in recent times, a theme easily accessed by a growing number of exchange-traded funds. Emerging markets investing, including doing so with ETFs, is changing, presenting investors with opportunities to take more tactical, thematic approaches to tap into the rise of developing world consumers. With many traditional emerging markets ETFs either too concentrated in the BRIC nations, excessively exposed to state-run enterprises or both, investors should rethink how they access emerging markets consumer trends. That includes making bets on some of the least developed developing markets. “Investors should focus on buying EM consumer companies in the least developed economies, as well as those EM companies geared towards domestic demand, rather than external demand through exports. Investors should look for stocks in the discretionary sector in countries where the consumption of staples has been satisfied, but consumption of durable goods has not,” according to Emerging Global Advisors , the company behind the EGShares family of ETFs. EGShares’ ETFs include consumer-focused offerings such as the EGShares India Consumer ETF (NYSEArca: INCO ) , the EGShares Emerging Markets Consumer ETF (NYSEArca: ECON ) and the EGShares Emerging Markets Domestic Demand ETF (NYSEArca: EMDD ). ECON, which carries a four-star rating from Morningstar, is up 15.4% over the past three years, enough to easily outpace the Vanguard FTSE Emerging Markets ETF (NYSEArca: VWO ) and the iShares MSCI Emerging Markets ETF (NYSEArca: EEM ) . The allure of ECON, one of the original dedicated emerging markets consumer ETFs, comes from its large combined weight to reform minded countries. For example, China, Mexico and India combine for over 41% of the ETF’s weight. “The new Indian government, led by Prime Minister Narendra Modi, intends to privatize state assets, increase foreign direct investment and reduce the fiscal deficit by cutting subsidies. There are also plans to deregulate the labor market and upgrade infrastructure. These improvements should unleash investment, increase efficiency, raise productivity and boost growth,” said EGShares in a whitepaper . If Modi delivers on the expected reforms, that could power INCO even higher. Often overlooked compared to other India ETFs , INCO also carries a Morningstar four-star rating. More important than that accolade is INCO’s performance. For much of the past year, India ETFs have been BRIC leaders, but INCO has shined especially bright with a gain of almost 77%. EMDD tracks the S&P Emerging Markets Domestic Demand Index, and draws from a country universe of Brazil, Chile, China, Colombia, Czech Republic, Egypt, Hungary, India, Indonesia, Malaysia, Mexico, Morocco, Peru, Philippines, Poland, Russia, South Africa, Thailand, and Turkey. Though not a pure consumer ETF, EMDD does allocate a combined 56.6% of its weight to staples and discretionary sectors. The weight to those sectors is important because consumer sectors have been key contributors to emerging markets earnings growth in recent years. “Emerging market consumer sectors have delivered higher earnings growth in four of the last seven years when compared to the broader emerging market equity index. Although earnings have disappointed over the last two years, we believe this should be a temporary relapse since consensus earnings are forecast to rebound in 2014 and 2015. Based on these estimates, EGA calculates that the EM consumer sectors would deliver earnings growth of 4.1% in 2014 and 16.2% in 2015, respectively, surpassing the rates of growth offered by the overall emerging markets index (3.8% in 2014 and 9.0% in 2015),” according to EGShares. South Africa, China and Mexico combine for over 55% of EMDD’s country weight. The ETF’s index has an impressive dividend yield of almost 3.4%. EM Consumer Fundamentals Table Courtesy: Emerging Global Advisors Tom Lydon’s clients own shares of EEM.
ETF Securities Expands Equity ETF Lineup With Two More New Funds

ETF Securities is expanding its line of factor-based equity ETFs. A closer look at the two new smart-beta, index-based ETFs. Based off ERI Scientific Beta indexing methodologies. ETF Securities, the London-based exchange-traded funds issuer known primarily for its lineup of commodities funds, is again adding to its lineup of U.S.-listed equity-based offering with the debuts of the ETFS Diversified-Factor U.S. Large Cap Index Fund (NYSEARCA: SBUS ) and the ETFS Diversified-Factor Developed Europe Index Fund (NYSEARCA: SBEU ) . ETF Securities is partnering with ERI Scientific Beta on the new ETFs. Scientific Beta is an index provider specializing in smart beta solutions and is part of the EDHEC-Risk Institute, an entity that works closely with institutions to implement academic research and improve their investment and risk management process, according to a statement . Scientific Beta’s stock selection process includes emphasizing investment factors, such as volatility, valuation, momentum and size. Factor-based funds are one of the fastest-growing segments of the ETF universe. The quality factor alone is the cornerstone of nearly 30 ETFs and issuers continue to bring an array of factor-driven ETFs to market. Since the start of 2015, JPMorgan introduced the JPMorgan Diversified Return Emerging Markets Equity ETF (NYSEARCA: JPEM ) , a multi-factor emerging markets ETF while iShares added two international ETFs to its factor-based suite. The ETFS Diversified-Factor U.S. Large Cap Index Fund tracks the Scientific Beta United States Multi-Beta Multi-Strategy Equal Weight Index, which “uses a proprietary weighting strategy to provide well diversified exposure, by combining 5 models: Maximum Deconcentration, Maximum Decorrelation, Efficient Minimum Volatility, Efficient Maximum Sharpe Ratio, and Diversified Risk Weighted,” according to ETF Securities . Financial services is the largest sector weight in SBUS at 19.2% followed by consumer cyclicals at 13.9%. No stock accounts for more than 0.72% of the new ETF’s weight. Top 10 holdings include CareFusion (NYSE: CFN ), Annaly Capital (NYSE: NLY ) and Dow component Merck (NYSE: MRK ). The ETFS Diversified-Factor Developed Europe Index Fund tracks the Scientific Beta Developed Europe Multi-Beta Multi-Strategy Equal Weight Index, which “is composed of the 700 largest and most liquid stocks listed in the following countries: Austria, Belgium, Denmark, Finland, France, Germany, Greece, Ireland, Italy, The Netherlands, Norway, Portugal, Spain, Sweden, Switzerland and the United Kingdom,” according to ETF Securities . The ETF currently holds 476 stocks, nearly a third of which are U.K. companies. France and Germany combine for over 23% of the new ETF’s weight. Top sector weights include 22.6% to financial services, 17% to industrials and 13.3% to consumer cyclicals. Both new ETFs charge 0.4% per year. SBUS and SBEU debuted on the heels of ETF Securities’ initial forays into U.S.-listed equity ETFs. Those ETFs, the ETFS Zacks Earnings Large-Cap U.S. Index Fund (NYSEARCA: ZLRG ) and the ETFS Zacks Earnings Small-Cap U.S. Index Fund (NYSEARCA: ZSML ) launched last week. ETF Trends editorial team contributed to this post.

Closed End Funds: Where Does That Discount Go?

Summary If you buy CEFs you are probably on the lookout for discounts to NAV. Buying on the cheap has its benefits, but doesn’t guarantee capital appreciation. It’s worth taking a few seconds to consider what can happen to a discount before jumping into CEF land. Who doesn’t like getting a good deal? And closed-end funds, or CEFs, are one of the best ways to do that in the investing world because they often trade below the value of their assets. But, just getting a cheap price doesn’t mean you’ll make out well. And before just buying for the discount, you should take a moment to think about what happens “next.” An odd beast I’ve described CEFs as the El Camino of the investment world. The El Camino, if you don’t know, is a car with a sedan/station wagon front attached to a pickup/flat bed rear end. It stands out, to say the least. Closed-end funds are similar in that they are a pooled investment vehicle like an open-end mutual fund, but they trade on stock exchanges like a stock with a set number of shares. That creates the interesting situation where a CEF can trade below the value of its portfolio, or net asset value. The NAV, as it’s called, is just the value of the portfolio divided by the number of shares outstanding. That can never happen in the open-end world, because open-end mutual fund companies stand ready to buy and sell shares at NAV when the market closes every day. So, CEFs often present great opportunities to buy on the cheap. Adams Express (NYSE: ADX ) is a good example. Right now it trades at around a 14% discount to NAV. So, for every dollar you spend buying Adams you get $1.14 or so worth of stock. Great! Your yield is also higher than it otherwise might be. For example , based on Adams Express’ year-end 2014 price ($13.68) and full year distributions ($1.18 per share), its trailing yield was 8.6%. That, however, is higher than the yield of 7.4% when it’s based on the year end NAV of $15.87 a share. So, there are good reasons to like CEFs trading at discounts. However, according to the Closed-End Fund Association , Adams Express’ discount over the trailing five years is about 14%. Over the trailing decade it’s… about 14%. While the discount goes up and down over time, you should probably expect Adams to trade at about a 14% discount all the time. Yes, you are benefiting in some ways from the price discrepancy, but you’re probably not going to benefit from a narrowing of that spread. Up and down So, a persistent discount is one possible outcome with a CEF. But what else could happen. The most desirable outcome, obviously, is for the price of the CEF to rise and close the gap. That would result in capital gains. A recent example of this is exactly what’s taken place at GAMCO Global Gold, Natural Resources & Income Trust (NYSEMKT: GGN ) and GAMCO Natural Resources, Gold&Income Trust (NYSE: GNT ). This pair of precious metals and natural resources funds were trading at discounts of 5% and 6%, respectively, early in January. In just a few weeks those discounts had narrowed to 1% and 4%, respectively. That led to capital appreciation of 8% for GGN and 5.5% for GNT. Annualized, those are huge gains. This particular trade was most likely made possible by year-end tax loss selling. GGN and GNT have a habit of seeing their discounts widen at the end of the year only to narrow as the new year progresses. This is, in the end, ideal: Buy something on the cheap and then watch as other investors realize it’s cheap and bid the price up. But, this works both ways. If you had purchased GGN on June 2nd last year it would have cost you around $10.29 a share. The NAV at that point was $10.07 a share. That is, in fact, a premium of about 2%. By January 27th of this year, the price had declined to $7.70 a share, with the NAV falling only to $7.84 – resulting in a discount of around 2%. Now, clearly, oil prices falling off a cliff had something to do with GGN’s price decline since it has notable exposure to the energy industry. But, this example shows very clearly that the difference between price and NAV works both ways. And, you can wind up a loser if the change between the two goes against you. This is exactly why buying a fund at a premium can be so risky. PIMCO High Income Fund (NYSE: PHK ) is an extreme example of this right now since it’s currently trading hands at an over 50% premium. If the difference between price and NAV narrows because the price falls toward the NAV, investors could feel a lot of pain. Although I don’t expect this to happen with PHK, there’s also the chance that the NAV of a fund trading with a premium could rise while the market price stagnates. That would narrow the discrepancy and bring things closer to a rational relationship. However, it would do very little for shareholders since the market price would have to sit and do nothing for this to happen. Looking at the flip of that, a fund with a discount could see the NAV stagnate and the market price of the shares rise, narrowing the discount. That would, obviously, lead to capital appreciation. Options! That, however, is just as unlikely as PHK’s market price flat lining, since the only constant on Wall Street is change. But it’s a good thought experiment to consider all of these possibilities because it prepares you for what could happen. That’s particularly important because the unusual relationship between price and NAV for closed-end funds can be confusing and, perhaps, lead you to rash decisions if you haven’t given this nuance enough consideration. So, to make things really confusing: a discount can narrow because the market price of a CEF goes up while the NAV stagnates, because it goes up faster than the NAV is rising, or because it goes up while the NAV is going down. A discount can expand and a premium disappear because the share price falls while the NAV is stagnant, the share price falls faster than the NAV is falling, because the NAV goes up while the share price goes down, or because the NAV goes up faster than the share price. The relationship between the NAV and share price can also just stay the same, as Adams Express shows. There are, clearly, a lot of possible outcomes, and I might have missed some. But, complexity shouldn’t stop you from giving this some thought because you might see any of the above changes taking place at any given time. And, you’ll want to understand before that happens what it means for your investment outcome. In the end, if the only thing you take away from this is that PHK is trading at a dangerously high premium, that’s good enough for me. But, I hope you’ll take a moment to meditate on CEF discounts and premiums – it’s better to prepare with knowledge than react poorly to something about which you could have forewarned yourself.