Tag Archives: linkedin

Recent Volatility Providing Potential Buying Opportunity In The Biotechnology Space

Summary IBB was pulled back roughly 20% from its 52-week high this week with shares plunging from $400 to $320 per share during the recent market weakness. Persistently low oil prices, fear of an imminent rate hike and weakness in China have indiscriminately pulled down all indices over the past week. These external events are largely extraneous to the biotechnology sector and thus may present a buying opportunity throughout pullbacks if adding to a position or initiating a new position. Medical and prescription drug expenditures are projected to grow at an average rate of 5.8% and 6.3% annually through 2024, respectively. Taken together, this may present a potential buying opportunity especially given the recent market volatility. Introduction: The confluence of persistently lower oil prices, fear of an imminent rate hike and more notably weakness in China have indiscriminately plummeted all indices over the past week. These external events are largely extraneous to the biotechnology cohort yet this group has been taken along for the downhill ride with the broader indices. The biotechnology sector has been on an unprecedented performance streak in both annual and cumulative performance over the past 10 years and accentuated during the latest 5 year timeframe however lately this streak has been tested during the recent market volatility. The biotechnology sector can be highly volatile, however I posit that this cohort has not only established itself as a secular growth sector but these latest events are unrelated to the biotech sector and thus this recent pullback may provide a potential opportunity to add to a current position or initiate a position over time as this correction unfolds. Using The iShares Nasdaq Biotechnology ETF (NASDAQ: IBB ) as a proxy, based on annual and cumulative performance throughout both bear and bull markets, IBB may provide the opportunity investors have been waiting for in the face of the current market downturn. IBB is touched down to register a 20% decline from its 52-week high, shares have plunged from $400 to $320 at one point per share during the recent market weakness, presenting a potential buying opportunity. Growth expenditures as a rational for buying on major pullbacks: Per the Centers for Medical and Medicaid Services, medical expenditures are projected (from 2014 through 2024) to grow at an average rate of 5.8% per year. This translates into 1.1% faster than GDP throughout this time period thus the healthcare expenditures as a percentage of GDP are expected to rise from 17.4% in 2013 to 19.6% by 2024. Despite several years of growth below 5%, health spending is projected to have grown 5.5% in 2014. Faster health spending due mainly to ACA health insurance coverage and rapid growth in prescription drug spending. The domestically insured is projected to have increased from 86% in 2013 to 89% in 2014 as 8.4 million individuals are projected to have gained coverage. Post 2014, national health spending is projected to grow at a 5.3% clip in 2015 and peak at 6.3% in 2020. Given these projections, this scenario bodes well for the biotechnology sector as more individuals have access to health coverage and prescription drugs. In terms of prescription drug expenditures, spending is projected to have grown 12.6 percent in 2014 to $305.1 billion. Driving growth were new specialty drugs and increased prescription drug use among people who were newly insured. Prescription drug spending growth is projected to average 6.3% annual growth from 2015 through 2024. Taken together, as the biotechnology sector continues its innovation and continuous supply of medications to treat and cure many different diseases coupled with the growth in overall medical spending may present an investment opportunity especially given the recent market volatility. Secular growth case for buying on major pullbacks: In addition to case outlined above (e.g. highlighting the disconnect between the events bringing down the broader indices and the biotechnology sector on a whole) the biotech sector has displayed its resilience in both bear and bull markets with secular growth. The returns for IBB have been very impressive in both annual and cumulative performance, unparalleled by any major index. Over the past 10 and 5 year time frames, IBB has posted cumulative returns of over 360% and 325%, respectively. These results are unrivaled by any major index, outperforming on a 10 year cumulative basis of 295%, 240% and 300% for the S&P 500, Nasdaq, and Dow Jones respectively (Figure 1). These returns are accentuated during the previous 5 years. IBB notched cumulative returns of 325%, outperforming the S&P 500, Nasdaq and Dow Jones by 245%, 215% and 265%, respectively (Figure 2). IBB has cumulatively outperformed all indices by roughly 3-fold and 2.5-fold over the 10 year and 5 year time frames, respectively (Figures 1 and 2). (click to enlarge) Figure 1 – Google Finance comparison of IBB returns relative to the S&P 500, Nasdaq, Dow Jones over the previous 10 years (click to enlarge) Figure 2 – Google Finance comparison of IBB returns relative to the S&P 500, Nasdaq, Dow Jones over the previous 5 years IBB has displayed impressive resilience in the face of the market crash in 2008, the bear markets of 2011 and the very volatile market thus far in 2015. During the market crash of 2008, IBB posted an annual return of -12.2% while the S&P 500, Nasdaq and Dow Jones posted returns of -37.0%, -40.0% and -31.9%, respectively (Figure 3). During the bear market of 2011, IBB posted an annual return of 11.7% while the S&P 500, Nasdaq and Dow Jones posted returns of 2.1%, -0.8% and 8.4%, respectively (Figure 3). Thus far during the highly volatile market of 2015, IBB posted an annual return of 13% while the S&P 500, Nasdaq and Dow Jones posted returns of -5.8%, -0.8% and -8.6%, respectively (Figure 4). These data suggest that IBB outperforms during bear markets and thus has established itself as a secular growth sector and in the face of unrelated economic events may provide a buying opportunity. (click to enlarge) Figure 3 – Morningstar comparison of IBB annual returns relative to the Nasdaq over the previous 10 years (click to enlarge) Figure 4 – Google Finance comparison of IBB annual performance thus far in 2015 relative to the S&P 500, Nasdaq and Dow Jones Conclusion: As the confluence of these economic events seemingly disconnected in bringing down the biotechnology sector coupled with expenditure growth in overall health and prescription drug spending, it may be a good time to consider capitalizing on this correction via adding to existing positions or initiating a new position in this cohort given this opportunity. Being opportunistic and capitalizing on the recent volatility on pullbacks to slowly add to or initiate a position may be the opportunity investors have been waiting on to pounce on IBB. Data suggests, provided a long-term position that volatility within the biotech sector is negated by its long-term performance that is unparalleled by any major index. This sector provides high returns unrivaled by any major index with moderate risk (based on its resilience during the bear markets of 2008 and 2011 and thus far in 2015) and volatility. IBB may be providing investors with a great opportunity to add or initiate a position for any long portfolio desiring exposure to the biotechnology sector with a long-term time horizon given the recent market conditions. References: CMS.gov Statistics Trends and Reports Disclosure: The author currently holds shares of IBB and is long IBB. The author has no business relationship with any companies mentioned in this article. I am not a professional financial advisor or tax professional. I wrote this article myself and it reflects my own opinions. This article is not intended to be a recommendation to buy or sell any stock or ETF mentioned. I am an individual investor who analyzes investment strategies and disseminates my analyses. I encourage all investors to conduct their own research and due diligence prior to investing. Please feel free to comment and provide feedback, I value all responses. Disclosure: I am/we are long IBB. (More…) I wrote this article myself, and it expresses my own opinions. I am not receiving compensation for it (other than from Seeking Alpha). I have no business relationship with any company whose stock is mentioned in this article.
Are Investors Choosing The Right Indices And ETFs?

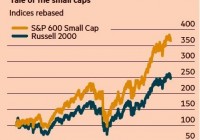
Summary ETFs are financial instruments that add an extra layer of risk that may not be suitable or ideal for all investors. Interestingly, since 2000, the S&P 600 has significantly outperformed it’s counterpart, the Russell 2000. Subconsciously, fund managers may be hurting their returns by stating they are “overweight” or “underweight” a stock, especially if using an easy to beat benchmark. Individual investors can gain an edge on professional fund managers by simply investing in indices and ETFs with a superior long-term track record. It’s conceivable that “brand names” will start to matter, as ETFs and Index Funds become more popular over the next decade. Introduction Warren Buffett has famously stated that Americans are better off investing in a simple index fund like the Vanguard S&P 500 ETF (NYSEARCA: VOO ). Investing in the S&P 500 exposes investors to American businesses and allows them to reap the benefits of an expanding and capitalistic economy. Branching away into different indices and ETFs introduces investors to varying degrees of risk and fall empty handed on the returns advertised. For example, an ETF that is composed of 30 securities is not only priced based on its underlying portfolio of securities, but also in accordance to the supply and demand of the ETF itself. This double jointed structure introduces several liquidity and volatility risks to investors in times of market turbulence and downturns. Furthermore, there are all sorts of differentiated structures that provide for excessive risk in hopes to achieve higher returns. Notably, all levered bull and bear ETFs. These structures introduce another layer of unknowns and risks for investors, with the speculative potential to increase returns. However, an investor is likely to achieve not only a lower risk profile, but higher returns by simply scrutinizing their portfolio with a careful eye– looking for an edge. The Russell 2000 vs The S&P 600 For the conservative investor, a seemingly simple question of investing in an ETF covering the Russell 2000 (like the iShares Russell 2000 ETF ( IWM)) or the S&P 600 (like the SPDR S&P 600 Small Cap ETF ( SLY)) can yield dramatically different results. As reported by the Financial Times on Monday August 17, 2015, the S&P 600 has outperformed its counterpart the Russell 2000 since year 2000–by a significant margin. Specifically, since the beginning of 2000, the S&P 600 would have turned a $100 investment into a little over $360 and a $100 investment in the Russel 2000 would have turned into approximately $250. Image Sourced from Finanical Times Hence, the framework on an underlying index can have a profound influence on an index’s performance, the related ETF’s performance, and an investor’s overall return. The S&P 600 may cover a slimmer portion of the small cap universe, but this may be for good reason. After all, an investor only needs to own 30 stocks to be amply diversified from systemic market risk. According to the Financial Times, the S&P 600 index requires companies to have a record of making profits before it is included in the index. Furthermore, it sets a far higher standard for liquidity (compared to Russell 2000). It’s no wonder then that small-cap investment firms use the Russell 2000 to track their performance against. It’s easier to beat! It’s amazing how two simple rules can create significant long-term value for clients and investors. As such, it appears reasonable to assume that an index’s brand and portfolio construction will have even more of an impact on investors’ decisions going forward. How robot advisors and, to an extent, human advisors, will account for these seemingly minute details remains to be seen. Regardless, a wise and enterprising investor will have an edge. A passive minded investor, with an enterprising spirit, would be able to increase their returns by sacrificing a small amount of time to discover discrepancies such as this-especially long-term investors who have 15+ year time horizons. Index Business Growing In Size and Power Building ETFs based on indexes has become a huge business, with hundreds of billions riding on the skirts of simple structures. The owners of these indexes, whether it’s MSCI (NYSE: MSCI ), FTSE Russell, or the S&P (NYSE: MHFI ) will continue to have more and more power and influence on the financial markets-along with their clients like Vanguard and Blackrock (NYSE: BLK ). Whether or not they use this power wisely is another question, one that I’m not overly optimistic about. Furthermore, transparency can be a double-edged sword. For instance, the Russell 2000 follows very transparent rules by alerting investors in advance which stocks will move in and out on the day each June when the index is reshuffled (making it easier to beat). The S&P 500 Index has discretion to include companies that have a history of recording a profit, maintaining a balance between sectors, and typically only includes new companies when a vacancy is created (often through a merger). Invariably this causes the stock to pop as it is added to the S&P 500 Index, creating agony among fund managers attempting to beat it. Psychology of the Index Behavior psychology (or anything to do with human behavior) continues to have a heavy influence on the performance of fund managers. It’s well-known that investors and fund managers must account for self-bias and over-confidence once they buy a particular security, otherwise their judgment may become impaired and make mistakes. Recently, there has been a change in the way fund managers and analysts talk about their portfolios. For instance, they often speak of being “overweight” or “underweight” a particular stock, rather than stating they “own” a stock. By stating that they are “overweight” or “underweight,” fund manager’s are subconsciously increasing the influence a benchmark index has on their portfolio allocation and investment returns. It’s well known that the majority of actively managed mutual funds fail to beat their benchmarks. Therefore, it stands to reason that individual investors should outperform fund manager’s who chose the Russell 2000 as their benchmark–by simply investing in the S&P 600! While past performances do not guarantee future returns, it’s hard to argue the long-term track-record of the S&P 600 compared to the Russell 2000 over the past 15 years. In essence, investors who look at a stock as a fractional ownership of an underlying business will have both a psychological and fundamental advantage over other investors during a long-term time horizon. Fund managers that state they “own” a stock are still subject to subconscious self-bias and overconfidence; however, it’s likely they would focus more of their time on the fundamentals of the business, rather than the makeup of a particular benchmark. A stock’s total return, after all, is proportional to the company’s long-term operating performance and returns on capital, not because of its weighting in a particular index. Conclusion Just like it’s never wise to ask your barber if you need a haircut, investors shouldn’t accept over-simplified financial products and investments, especially from Wall Street. A little bit of research and passion to find an edge can go a long way. Remember that in a group of 100 investors, only 49 can be better than average-despite everyone’s opinions that they are in the top 20%. Managing your time wisely and performing diligent research has the potential to add a percentage or two to your total returns over your lifetime. In addition, you will incur fewer trading and tax expenses due to mistakes and disappointments. Apply diligent research, patience, and a long-term time horizon to maximize the benefits you receive from the miracles of compound interest. Don’t let sloppy benchmark indices get in your way–invest in the best ones. Disclosure: I/we have no positions in any stocks mentioned, and no plans to initiate any positions within the next 72 hours. (More…) I wrote this article myself, and it expresses my own opinions. I am not receiving compensation for it (other than from Seeking Alpha). I have no business relationship with any company whose stock is mentioned in this article.

HEDJ: Is There Any More Upside In This Euro-Hedged ETF?

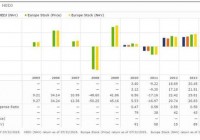
Summary The euro hit a 10-year low relative to the dollar and depreciated dramatically by 22% over a 12 month period leading into April of 2015. As the recent resistance and ostensible capitulation in the euro has taken hold investors may be better positioned in a long non-hedged European position. Since the sharp fall in the euro has subsided over the past four months, the two currencies appear to be normalizing against each other. Resistance has been seen at $1.05 (EU/USD) and the disparity between the two currencies has been retracing towards this level. Over the past 4 months a significant performance divergence exemplifies this phenomenon between hedged (HEDJ) and non-hedged (VGK) European ETFs. Introduction: In my previously published articles (on April 6th 2015: ” The Inevitable Capitulation Of The Euro Hedge ” and on May 20th 2015: ” The Inevitable Capitulation Of The Euro Hedge has begun “), I posited rotating money out of the WisdomTree Europe Hedged Equity (NYSEARCA: HEDJ ) ETF into a long non-hedged European equity position such as the Vanguard FTSE Europe ETF (NYSEARCA: VGK ). This thesis was rooted in three major pillars: 1) The Euro had depreciated relative to the dollar by more than 20% leading into April of 2015. 2) The currency disparity rendered a 10-year low for the euro relative to the dollar. 3) The Euro hedge within HEDJ had been largely attributable to this outperformance over an 18 month time period through April of 2015 relative its indices. Now four months later, two additional attributes may further support this thesis: 1) The Greece crisis is behind us and while this situation was not factored in to my previous articles as a potential event, this fiasco did not negatively impact the euro beyond the $1.05 resistance level. 2) As a looming interest rate increase by the Federal Reserve is on the horizon, this inevitable event may be priced in to some extent and thus the impact on the currency discrepancy may not be as dramatic as previously thought. This partial priced in event will mitigate the downside effect of the euro relative to the dollar when an interest rate increase takes place. Investors in the WisdomTree Europe Hedged Equity ETF have been rewarded handsomely over the past year leading into April of 2015 as the euro has depreciated relative to the dollar in spectacular fashion by more than 20% through March of 2015. HEDJ possess a hedge component exploiting this currency difference on the side of the US dollar, thus investors are rewarded as the euro weakens in relation to the dollar. I posited that this hedge may inevitably become a liability as the two currencies normalize against each other and thus back in April it was time to be in the sell camp of this hedged ETF prior to this hedge component working against investors in HEDJ. I suggested, as Europe continues to strengthen throughput 2015 and beyond, investors may be better positioned in a long European holding such as the Vanguard FTSE Europe ETF as opposed to the euro-hedged HEDJ. This article revisits this thesis four months removed to quantitatively assess the recent movement in the dollar and its impact on the performance of the hedged and non-hedged ETFs. The hedge: the depreciating euro relative to the US dollar HEDJ has outperformed its non-hedged index by a wide margin in 2014 and 2015 albeit through March. HEDJ outperformed the Morningstar non-hedged Europe Stock index on an annual basis by 11.3% and 11.9% in 2014 and 2015 (through March), respectively (Figure 1). However that outperformance of 11.9% through March has given up ground and has since fallen to an outperformance spread of 7.6% YTD (Figure 1). Per WisdomTree, HEDJ seeks to provide investors with exposure to European equities with a built-in hedge against the euro while focusing on companies that conduct a significant portion of their business overseas (non-euro exposure). “The Index and Fund are designed to have higher returns than an equivalent non-currency hedged investment when the value of the U.S. dollar is increasing relative to the value of the euro, and lower returns when the U.S. dollar declines against the euro.” This currency hedge has played out well for investors as the euro has slid against the dollar over the previous 12 months through March of 2015 (Figure 2). The euro sat at a 10-year low against the dollar with a sharp 22% depreciation seen over the previous 12 months heading into April of 2015 (Figures 2 and 3). A sharp divergence between the two currencies can be seen in figures 2 and 3, demonstrating this 20% slide. From these data, I stated that currency fluctuations are transient over the long-term, thus the euro hedge will likely capitulate in the near term. (click to enlarge) Figure 1 – Morningstar annual performance of HEDJ relative to a non-hedged Morningstar Europe Stock index (click to enlarge) Figure 2 – Google Finance graph showing the euro depreciation relative to the dollar over the previous 12 months leading into April of 2015 (click to enlarge) Figure 3 – Google Finance graph showing the euro depreciation relative to the dollar over the past 10 years heading into April of 2015. The capitulation of the euro hedge may be unfolding Recent data suggests that the perpetual falling of the euro may be coming to an end relative to the dollar (Figure 4). There also appears to be a firm resistance at ~$1.05. The euro touched down twice at or near $1.05 in Mach and April (Figure 4). Given the most bullish case for the dollar, some analysts are projecting the dollar to hit $0.95 by the end of the year. Assuming that the dollar hits that mark, this translates into another ~9% move after the already 22% move. Investors may be safe remaining in the hedge for now without much upside given the most bullish case. Given the most bullish estimates, I’d be content capturing over 70% of that spread and rotating money out of that position into a long European position such as VGK if investors would like to maintain exposure to European equities. (click to enlarge) Figure 4 – Google finance YTD performance of the euro relative to the dollar Hedge verses non-hedge performance: HEDJ and VGK Taking a close look at a long European ETF position via VGK (which I wrote about in detail here ) in comparison to the euro hedged HEDJ over the long-term exemplifies that currency fluctuations are transient over the long-term and this euro hedge will likely continue to capitulate in the near term. In 2012 and 2013 HEDJ underperformed VGK on an annual basis at times when the euro and dollar were mostly stable relative to each other (Figure 5). This hedge play has been highly favorable for investors over the most recent 12 month time period through March of 2015 however the currencies will inevitably start to trend to the inverse of this hedge as recent data suggests. At the point of initial reversion to the mean, this hedge will essentially be rendered useless and VGK will outperform as it did in 2012 and 2013. As the euro depreciation seems to have been arrested, HEDJ will likely continue its capitulation and underperform with any further uptick in the euro. This has been the case over the past four months, where VGK has outperformed HEDJ by 3.0% (Figure 6). These data suggest that VGK may be superior moving into the future and combined with the recovery in Europe, it may be time to abandon HEDJ and be long European equities without the euro hedge prior to the hedge working against the investor. (click to enlarge) Figure 5 – Morningstar annual return comparison between HEDJ and VGK through March of 2015 (click to enlarge) Figure 6 – Performance divergence between VGK and HEDJ over the previous four months since my initial article Conclusion: HEDJ has outperformed the non-hedged Morningstar Europe Stock index on an annual basis in 2014 by 11.3% and 11.9% through March in 2015. It is noteworthy to point out that this 11.9% outperformance has dwindled down to a 7.6% outperformance YTD. Specifically regarding HEDJ vs VGK, HEDJ maintains an outperformance of 11%, down from 14.3% since my last article in April. The hedge against the euro within HEDJ is largely attributable to this outperformance over the 12 month time period through March. Considering that the euro appears to have capitulated from its 10-year low preceded by a sharp depreciation by more than 20% indicates that this hedge may have played out. Continued exposure to this hedge may inevitably become more of a liability as the two currencies normalize against each other and thus it may be time to take profits. As Europe continues to strengthen throughput 2015 and beyond, investors may be better positioned in a long European ETF such as VGK. If the European economic strength is enough to mitigate the dollar rise after the Federal Reserve increases rates then there’s limited upside to remaining in this hedge. In terms of quality attributes, HEDJ lacks adequate diversification (by design) and provides a dividend yield inferior to that of VGK and the expense ratio is 6 times that of VGK (0.58%). Taken together, this euro hedge has provided investors with great returns however data suggest currency fluctuations are transient over the long-term and this euro hedge may not add any additional value to one’s portfolio moving into the future. Disclosure: The author currently holds shares of VGK and is long VGK. The author does not hold shares of HEDJ. The author has no business relationship with any companies mentioned in this article. I am not a professional financial advisor or tax professional. I am an individual investor who analyzes investment strategies and disseminates my analyses. I encourage all investors to conduct their own research and due diligence. Please feel free to comment and provide feedback. I value all responses. Disclosure: I am/we are long VGK. (More…) I wrote this article myself, and it expresses my own opinions. I am not receiving compensation for it (other than from Seeking Alpha). I have no business relationship with any company whose stock is mentioned in this article.