Tag Archives: latest-articles

NOBL Looks Solid Despite A Weaker Dividend Yield Than I Would Have Expected

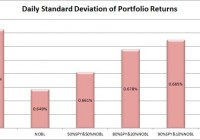
Summary I’m taking a look at NOBL as a candidate for inclusion in my ETF portfolio. For having “Dividend” in the name, the yield isn’t as strong as I expected. The portfolio has been fairly steady, lower deviation of returns than SPY. The expense ratio is my only real concern here, because the gross and net are not the same. I’m hoping the net stays put. I’m not assessing any tax impacts. Investors should check their own situation for tax exposure. How to read this article : If you’re new to my ETF articles, just keep reading. If you have read this intro to my ETF articles before, skip down to the line of asterisks. This section introduces my methodology. By describing my method initially, investors can rapidly process each ETF analysis to gather the most relevant information in a matter of minutes. My goal is to provide investors with immediate access to the data that I feel is most useful in making an investment decision. Some of the information I provide is readily available elsewhere, and some requires running significant analysis that, to my knowledge, is not available for free anywhere else on the internet. My conclusions are also not available anywhere else. What I believe investors should know My analysis relies heavily on Modern Portfolio Theory. Therefore, I will be focused on the statistical implications of including a fund in a portfolio. Since the potential combinations within a portfolio are practically infinite, I begin by eliminating ETFs that appear to be weak relative to the other options. It would be ideal to be able to run simulations across literally billions of combinations, but it is completely impractical. To find ETFs that are worth further consideration I start with statistical analysis. Rather than put readers to sleep, I’ll present the data in charts that only take seconds to process. I include an ANOVA table for readers that want the deeper statistical analysis, but readers that are not able to read the ANOVA table will still be able to understand my entire analysis. I believe there are two methods for investing. Either you should know more than the other people performing analysis so you can make better decisions, or use extensive diversification and math to outperform most investors. Under CAPM (Capital Asset Pricing Model), it is assumed every investor would hold the same optimal portfolio and combine it with the risk free asset to reach their preferred spot on the risk and return curve. Do you know anyone that is holding the exact same portfolio you are? I don’t know of anyone else with exactly my exposure, though I do believe there are some investors that are holding nothing but SPY. In general, I believe most investors hold a portfolio that has dramatically more risk than required to reach their expected (under economics, disregarding their personal expectations) level of returns. In my opinion, every rational investor should be seeking the optimal combination of risk and reward. For any given level of expected reward, there is no economically justifiable reason to take on more risk than is required. However, risk and return can be difficult to explain. Defining “Risk” I believe the best ways to define risk come from statistics. I want to know the standard deviation of the returns on a portfolio. Those returns could be measured daily, weekly, monthly, or annually. Due to limited sample sizes because some of the ETFs are relatively new, I usually begin by using the daily standard deviation. If the ETF performs well enough to stay on my list, the next levels of analysis will become more complex. Ultimately, we probably shouldn’t be concerned about volatility in our portfolio value if the value always bounced back the following day. However, I believe that the vast majority of the time the movement today tells us nothing about the movement tomorrow. While returns don’t dictate future returns, volatility over the previous couple years is a good indicator of volatility in the future unless there is a fundamental change in the market. Defining “Returns” I see return as the increase over time in the value known as “dividend adjusted close”. This value is provided by Yahoo. I won’t focus much on historical returns because I think they are largely useless. I care about the volatility of the returns, but not the actual returns. Predicting returns for a future period by looking at the previous period is akin to placing a poker bet based on the cards you held in the previous round. Defining “Risk Adjusted Returns” Based on my definitions of risk and return, my goal is to maximize returns relative to the amount of risk I experienced. It is easiest to explain with an example: Assume the risk free rate is 2%. Assume SPY is the default portfolio. Then the risk level on SPY is equal to one “unit” of risk. If SPY returns 6%, then the return was 4% for one unit of risk. If a portfolio has 50% of the risk level on SPY and returns 4%, then the portfolios generated 2% in returns for half of one unit of risk. Those two portfolios would be equal in providing risk adjusted returns. Most investors are fueled by greed and focused very heavily on generating returns without sufficient respect for the level of risk. I don’t want to compete directly in that game, so I focus on reducing the risk. If I can eliminate a substantial portion of the risk, then my returns on a risk adjusted basis should be substantially better. Belief about yields I believe a portfolio with a stronger yield is superior to one with a weaker yield if the expected total return and risk is the same. I like strong yields on portfolios because it protects investors from human error. One of the greatest risks to an otherwise intelligent investor is being caught up in the mood of the market and selling low or buying high. When an investor has to manually manage their portfolio, they are putting themselves in the dangerous situation of responding to sensationalistic stories. I believe this is especially true for retiring investors that need money to live on. By having a strong yield on the portfolio it is possible for investors to live off the income as needed without selling any security. This makes it much easier to stick to an intelligently designed plan rather than allowing emotions to dictate poor choices. In the recent crash, investors that sold at the bottom suffered dramatic losses and missed out on substantial gains. Investors that were simply taking the yield on their portfolio were just fine. Investors with automatic rebalancing and an intelligent asset allocation plan were in place to make some attractive gains. Personal situation I have a few retirement accounts already, but I decided to open a new solo 401K so I could put more of my earnings into tax advantaged accounts. After some research, I selected Charles Schwab as my brokerage on the recommendation of another analyst. Under the Schwab plan “ETF OneSource” I am able to trade qualifying ETFs with no commissions. I want to rebalance my portfolio frequently, so I have a strong preference for ETFs that qualify for this plan. Schwab is not providing me with any compensation in any manner for my articles. I have absolutely no other relationship with the brokerage firm. Because this is a new retirement account, I will probably begin with a balance between $9,000 and $11,000. I intend to invest very heavily in ETFs. My other accounts are with different brokerages and invested in different funds. Views on expense ratios Some analysts are heavily opposed to focusing on expense ratios. I don’t think investors should make decisions simply on the expense ratio, but the economic research I have covered supports the premise that overall higher expense ratios within a given category do not result in higher returns and may correlate to lower returns. The required level of statistical proof is fairly significant to determine if the higher ratios are actually causing lower returns. I believe the underlying assets, and thus Net Asset Value, should drive the price of the ETF. However, attempting to predict the price movements of every stock within an ETF would be a very difficult and time consuming job. By the time we want to compare several ETFs, one full time analyst would be unable to adequately cover every company. On the other hand, the expense ratio is the only thing I believe investors can truly be certain of prior to buying the ETF. Taxes I am not a CPA or CFP. I will not be assessing tax impacts. Investors needing help with tax considerations should consult a qualified professional that can assist them with their individual situation. The rest of this article By disclosing my views and process at the top of the article, I will be able to rapidly present data, analysis, and my opinion without having to explain the rationale behind how I reached each decision. The rest of the report begins below: ******** (NYSEARCA: NOBL ): ProShares S&P 500 Dividend Aristocrats ETF Tracking Index: S&P 500 Dividend Aristocrats Index Allocation of Assets: At least 80% (under normal circumstances) Morningstar Category: Large Blend Time period starts: November 2013 Time period ends: December 2014 Portfolio Std. Deviation Chart: (click to enlarge) (click to enlarge) Correlation: 94.40% Returns over the sample period: (click to enlarge) Liquidity (Average shares/day over last 10): Around 178,000 Days with no change in dividend adjusted close: 5 Days with no change in dividend adjusted close for SPY: 0 Yield: 1.6% Distribution Yield Expense Ratio: .35% Net and .70% Gross Discount or Premium to NAV: .08% premium Holdings: (click to enlarge) Further Consideration: Yes Conclusion: For a dividend yield ETF, the yield was lower than I expected. However, the ETF has very strong liquidity which reinforces the correlation. While I’d love to see lower levels of correlation, I don’t expect to see low levels in an ETF designed to invest in several large dividend companies. The cross over between SPY and NOBL is going force correlation to be fairly high. ETF investors may be more impressed with the lower standard deviation of returns. The 5 days in which dividend adjusted close didn’t change were not reflecting any liquidity problems, as volume was not 0 for any of the days in my sample. The Net expense ratio isn’t bad, but I would want to look into provisions that would keep it from increasing. At a .35% net expense ratio I’m interested, but if that were to climb, my interest level would fade pretty rapidly. I have no problem with the holdings, though I prefer a little more diversification. I can’t complain too much though with the positions being around 2%. The standard deviation of returns was fairly interesting to me given how the stock ended up with almost exactly the same gains as SPY and very high correlation. I put together a little bit of theory on that in the section below. Be warned, it’s written for people that are already familiar with statistics and enjoy the theory. I put it after the conclusion because I believe it will confuse many readers and the information is not necessary to understand my analysis. For the statistics lovers The stock trades at around $50.00 rather than around $200 for SPY. The lower share price means smaller deviations in value (by fractions of a cent) may be rounded down to nothing. This could result in a slightly lower standard deviation of returns. Some readers thinking about the bell curve may recognize that this could be a double edged sword for the standard deviation. While rounding towards the mean would reduce the standard deviation, when the scale tips in the other direction the rounding could increase the standard deviation. The reason I expect those factors to not offset perfectly is because the bell curve is tallest in the middle. If the population was a standard normal distribution, the values should be rounded towards the center more often than they would be rounded away. On the other hand, each time that it is rounded away from the mean produces more standard deviation than the times in which it is rounded towards the mean. I don’t expect the factors to offset perfectly, but it is beyond my knowledge to know which way it would tilt the deviation because of the two opposing forces.
The SNB Catalyst For GLD

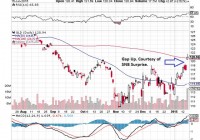
Summary SNB surprised the market by its sudden decision to abandon the EURCHF floor and reduce its deposit rate further to -0.75%. Existing push factor of GLD such as current deflation, strong USD and holding cost is being pushed aside by negative interest rates and market concern about market stability. Global negative interest interest rates is attracting bids for GLD especially when conservative investors cannot hold their funds in safe deposit and bonds without attracting a penalty. Deeper market concerns over the ability to grow the economies of Europe and Japan without destabilizing the economic system. SNB Surprise served as a catalyst to bring these concerns to the front of investors mind and is responsible for the gap up of GLD. The Swiss National Bank (SNB) surprised the market on 15 January 2015 by announcing the abandonment of the floor of the Swiss Franc (CHF) 1.20 to the euro. In addition, the SNB announced that it has reduced its sight deposit rate from -0.25% to -0.75%, effective 22 January 2015. The rationale that the SNB imposed this floor in 2012 is to prevent importing deflation from Europe but it has done it at the cost of a ballooning balance sheet to GDP from at least 60% to 85%. The SNB has finally accepted that deflation of -0.1% for this year and have made it clear that even if they do prevent deflation from Europe, they can’t prevent deflation from the U.S. through a strengthening USD. In this article, we will look at how the conflicting pull and push factors which affect the attractiveness of gold. In my previous articles, I have been bearish on gold as I consider opportunity cost of holding gold when the U.S. economy is rising and the fact that the strengthening USD will weaken gold. In addition, I have considered the fact that there is very little inflation worldwide given the low energy price. Hence gold would lose its allure as an inflation hedge, especially when it is increasingly clear that major economies like Japan and Europe is nearer to deflation than inflation. Negative Interest Rates Even as I consider these factors to be relevant, it would appear that other factors are now raising to the forefront to challenge these push factors of gold. The most prominent factor would have to be the negative interest rates. We are seeing a number of major countries imposing negative interest rates. The latest and deepest negative interest rates come from the SNB at -0.75% of deposit rates. The European Central Bank (ECB) has set its deposit rate to -0.1% and there are Japanese Treasury Bills that are having negative interest rates . This is because investors prefer these treasury bills even when key interest rates are zero and they are willing to pay a premium for it. Negative interest rate means that investors have to pay the banks to keep their money and this has offset the cost of gold purchase. For investors who are conservative, they are not likely to invest into equities which they perceive to be of high risk. Given that they can’t deposit their money safely in banks or bonds without attracting a penalty, they are more likely to be attracted to gold as a store of value. Market Concern about Economic Stability Then there is the risk of unintended consequences. With the ECB and Bank of Japan (BoJ) determined to ease monetary conditions further, they are increasing the risk that these actions will cause a bubble in the future. The issue is that inflation might surface in other form with all these QE efforts. These QE measures are described as emergency measures by the Fed and this is why they are being rolled back by the Fed right now. The question remains unanswered in the market as to whether a prolonged dosage of QE will actually help or harm the economy. We have to remember that the Fed used QE to purchase banks asset to restore confidence in the system and this is done with a bank stress test. The banks subsequently healed as investor confidence were restored and were able to lend as they have a clean balance sheet. They also have incentive to lend as the economy recovers amid a low interest rates environment. As the economy recovers, people consumes and we naturally see inflation which stands at 1.3% in December 2014. This will have been higher if not for low energy prices. There might be a question as to whether the banks started to lend first or the economy recovered and people consumed first before the banks were willing to lend. My opinion is that QE and the bank stress test cause the recovery in confidence first and the bank lending and consumption happened in tandem. The big question for Europe and Japan is that despite all these efforts in QE, we do not see a recovery in their economy. Europe is still having sub 1% growth and Japan has slipped into recession again with the second and third quarter of contraction in 2014. This might point to a bigger problem to their economies than what QE can solve. SNB Catalyst on GLD The SNB move to abandon the peg and lessen the deposit rate serves as a catalyst which brought the issue of negative interest rates to the forefront of investor’s mind. This is a signal to investors that there might be a paradigm shift in how major economies will operate from now on. The fact that the SNB has to surprise the market instead of following the usual central bank communications strategy which has been the norm for the past 10 years also hints at future uncertainty. In this environment, we are likely to see more demand from gold. We can see this from the SPDR Gold Trust ETF (NYSEARCA: GLD ) chart below. GLD tracks the performance of gold bullion after expenses and it is listed on the New York Stock Exchange. It is liquid with $27.54 billion of market capitalization and 17 million of last known daily transactions. (click to enlarge) Despite this liquidity, we see that GLD gap up on the SNB surprise. This is a clear sign that there are issues in the Europe and Japan which the market is concerned about. The market’s concern seems to be that despite the QEs, Japan and Europe would not be able to solve their issues. The side effect of these QE besides the massive purchase of securities, is to resort to negative interest rates which is forcing conservative investors out of safe deposit. These issues have always come along with QE and the market assumption has been that the recovery prospect will outweigh the risk involved as mentioned above. However the SNB surprise suggest otherwise and this is serving as a catalyst for these issues to surface and for GLD to gap up. Of course, the market has been wrong before and GLD was up from 2009 when the Fed started its first QE to 2011 when it was clear that the U.S. economy has recovered before GLD became bearish again. There is a possibility that this will be the start of a new bullish trend for the medium term if Europe and Japan is not able to get their act together. It would appear that even the strong USD cannot hold down GLD and this shows the depth of the market concerns.

Silver Ready To Run Higher In Major New Upleg

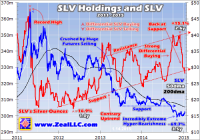
Silver is ultimately driven by gold’s fortunes, so as gold continues mean reverting higher silver is going to catch a massive bid. This buying will initially come from American stock traders and futures speculators, who will aggressively buy SLV shares, cover silver-futures shorts, and add new longs. This major new buying, likely to approach a staggering couple-hundred million ounces in a matter of months, will serve to launch silver higher. Silver looks to be on the verge of a major new upleg, finally emerging from the past couple years’ ugly sentiment wasteland. This beleaguered precious metal recently bottomed as futures speculators threw in the towel on their extreme shorting. And while investors’ ongoing silver stealth buying continues, it’s been modest. So there is vast room for capital inflows to accelerate dramatically as gold mean reverts higher. Silver has always had a special allure for hardened contrarian investors. Its price action is exceptionally volatile, with massive rallies erupting from time to time that multiply capital deployed in it. With silver’s relatively-small market size, it doesn’t take a lot of new investment buying to catapult prices higher. And shifting sentiment, a powerful self-feeding motivator, fuels the big swings in capital flows that really move silver. When investors wax bullish on this white metal, its price soars with a fury few other investments can match. Later when silver falls out of favor again, prices collapse . And that’s the miserable story of the past couple years. Silver dropped 19.7% in 2014 after plunging a brutal 35.6% in 2013. Such dismal performance naturally left silver universally despised, the pariah of the investment world. But that is changing. Silver is ready to run again , a very exciting prospect given the huge uplegs it is renowned for. Silver’s fundamentals are quite unique. Though it is primarily an industrial metal with steady global supply and demand, investment capital can slosh in and out in a big way. The bullish sentiment that’s necessary to trigger big silver demand spikes comes from one thing, gold prices. Gold dominates silver psychology. When gold is weak like during recent years, investors shun silver so its price crumbles and languishes. But when gold strengthens, investors flood back into the white metal. Silver leverages and amplifies gold’s gains, making it one of the best investments when gold is returning to favor. And gold’s long-overdue mean-reversion rebound upleg out of recent years’ crazy anomalous lows is now underway . While ultimately gold drives silver through that sentiment link, the daily capital flows responsible for most of the white metal’s price action largely come through two major conduits. Stock investors add or shed silver exposure by buying or selling shares in the flagship silver ETF, the Shares Silver Trust ETF (NYSEARCA: SLV ). And silver futures are the epicenter of speculation, where traders make big leveraged bets. Both the levels of SLV’s physical-silver-bullion holdings and American speculators’ aggregate long and short contracts in silver futures reveal silver is almost certainly embarking on a major new upleg. Each of these critical capital pipelines into silver shows great room for more investor and speculator buying. And that will come as gold continues recovering on balance, unwinding its extreme anomaly of recent years. Since the pools of stock-market capital are so vast, let’s start with SLV. This ETF’s mission is to track the price of silver so stock investors can gain diversifying exposure in their portfolios. Since the supply and demand for SLV shares almost never exactly matches that of underlying silver, differential buying and selling of ETF shares develops. If not addressed, it would soon force SLV to decouple from silver and fail. In order to keep SLV share prices closely mirroring the silver price, this ETF’s custodians have to quickly equalize any excess share supply and demand into silver bullion itself. When stock investors buy SLV shares faster than silver is being bought, SLV threatens to decouple to the upside. So its custodians issue new shares, adding supply to satisfy this excess demand. The cash raised is used to buy silver bullion . Conversely, when SLV shares are being sold faster than silver, it will soon fail to the downside. The only way to prevent this is to equalize the excess SLV-share supply into silver itself. SLV’s custodians do this by buying back excess SLV shares, with these purchases funded by selling some of the silver bullion held in trust for SLV shareholders. Thus SLV holdings levels are a key barometer of silver demand. And they now reveal low stock-investor exposure to silver prices, which is very bullish since that leaves lots of room for new buying as gold continues recovering. This first chart shows SLV’s physical-silver-bullion holdings in red, with SLV prices superimposed on top in blue. As stock investors see gold and therefore silver starting to move decisively higher, they are likely to buy tens of millions of ounces in short order. Silver’s last mini-mania peaked in April 2011, above $48 per ounce. For most of the time since, silver has been grinding lower on balance. As of early November 2014 in SLV terms, silver had fallen a brutal 69.7% over 3.5 years. That powerful bear market left silver universally loathed, deeply out of favor with investors and speculators. Most assumed that vexing downward spiral would persist indefinitely. But considering how rotten and epically bearish silver sentiment has been, the trend in SLV’s holdings has been rather amazing. Since way back in May 2012, years before silver would finally bottom, the bullion that SLV holds in trust for its shareholders has risen on balance . That means stock investors were buying SLV shares faster than silver was being bought, or selling them slower than it was being sold. This contrary uptrend has witnessed dazzling episodes of strong differential buying, most notably in early 2013, mid-2013, and late 2014. Unfortunately silver prices didn’t respond super-favorably to any of these since American futures speculators were dumping vast amounts of silver contracts at the same times. But if these speculators had merely been neutral on silver, its price would have soared on SLV buying. But after SLV’s holdings hit a relatively-high 350.2m ounces as December 2014 dawned, this ETF was slammed by heavy year-end differential selling pressure. That month alone its holdings fell 5.3%, and were down 6.8% total by last week. That represents massive silver selling pressure of 23.8m ounces. And the reason for this is easy to understand. Silver had really underperformed, and institutions dominate SLV. Pension funds, mutual funds, and hedge funds are the largest SLV shareholders by far. They always want to show winners on their trading books as years end, when many investors make decisions about which funds to allocate capital to. So there is lots of so-called window dressing in December, funds buying high-performing stocks while selling laggards. With SLV down 19.5% last year, it was sure the latter. In addition, in early November silver had just slumped to a deep new 4.7-year low on extreme futures shorting. Bearishness was off-the-charts epic, with virtually everyone convinced silver was doomed to spiral lower indefinitely. So I suspect plenty of fund managers capitulated after that, saying the heck with silver. Their exit certainly contributed to the major differential selling pressure SLV suffered last month. But actually lower SLV holdings are bullish . They imply stock investors are way underexposed to silver, and leave lots of room for capital to migrate back in. With gold recovering, the odds are very high that stock investors will soon return to SLV in a serious way. The resulting differential buying pressure on SLV shares should easily blast this ETF’s holdings back up near their multi-year resistance near 352m ounces. That would require 25.6m ounces of stock-investor silver buying in short order, a big number. To put this in perspective, the venerable Silver Institute reported total global silver investment demand in 2013 of 256.0m ounces. That equates to 21.3m per month. SLV’s holdings are poised to quickly surge by at least 25m, likely in a matter of weeks. This is big marginal investment demand in such a short period of time! And that projection is far too conservative. Note above that SLV’s holdings surged up to or over their uptrend’s resistance when silver prices were quite weak . Imagine how much more intense the stock-investor silver buying through SLV will be if silver is actually surging. I fully expect that this year SLV’s holdings will easily surpass their all-time record high of 366.2m ounces achieved back in April 2011. That would require enough differential buying of SLV shares to force its holdings 39.8m ounces higher, a massive boost in investment demand. And even at that old record, the amount of capital parked in SLV would still be small. Since silver prices were so high that last time silver was really in favor, SLV’s silver bullion held in trust for its shareholders was worth $17.2b. But silver is priced far lower these days. So the same record SLV holdings levels would be worth merely $6.2b today, just over a third as much. And capital measured in single-digit billions is a trivial drop in the bucket for the stock markets. It will only take a tiny fraction of stock investors parking some diversifying capital in SLV to blast its holdings dramatically higher. And all the resulting ETF underlying physical bullion buying will accelerate silver’s upleg. In the investing world, nothing begets demand like higher prices . Investors don’t want to own anything until it is already rallying, and the longer and higher it climbs the more they buy. So uplegs in silver, and anything really, tend to be self-feeding. Buying drives prices higher, which entices in still more buyers, which lifts prices even higher, and the cycle grows. So silver investing via SLV has vast upside potential. But in recent years stock-investor capital alone has proved insufficient to ignite a major silver rally. And that is where silver’s dominant day-to-day price driver comes in, the silver futures trading by American speculators . With investors largely missing in action still after silver’s excessively-weak past couple years, futures speculators’ trading is silver’s primary driver. This critical relationship is crystal-clear in this next chart. It shows American speculators’ total long and short contracts in silver futures on a weekly basis as reported by the CFTC in its famous Commitments of Traders reports. The green line is the total long contracts speculators hold, bullish bets on silver prices. And the red line is their total shorts, the bearish bets. The yellow line shows both series’ deviation from normal years’ averages, while SLV is rendered in blue again. Silver’s extreme 4.7-year lows back in early November were solely the result of extreme selling by those American futures speculators. They effectively capitulated, convincing themselves the universal hyper-bearish outlook for silver was righteous. So they aggressively shed long contracts while spectacularly ramping shorts, subjecting silver to withering selling pressure. It’s impressive silver didn’t crater much lower. Back in July after gold surged on the Fed’s Janet Yellen claiming there was no inflation, speculators’ leveraged long-side bets on silver hit a 3.7-year high of 90.3k contracts. But as bearishness set in again thanks to heavy gold-futures shorting , their longs collapsed by 20.5% or 18.5k contracts by early December. With each contract controlling 5000 ounces of silver, that was a lot of selling for the markets to absorb. We are talking about a staggering 92.6m ounces slamming the markets in less than 5 months! It’s no wonder silver slumped to major new lows under such a massive onslaught. But it gets even worse, as the new shorting by speculators was far more extreme than their long liquidation. Between late July and early November, speculators’ total shorts skyrocketed an astounding 166.2% or 43.7k contracts! Now in the futures markets, the price impact of an existing long contract being sold or a new short one being added is identical . So speculators shorting 43.7k new contracts deluged the markets with a truly mind-boggling 218.5m ounces of silver in just over 3 months! That is the equivalent to over 5/6ths of 2013’s total global investment demand. Silver’s resiliency despite that epic selling was actually amazing. Silver’s secular bull was born back in November 2001 at just $4 an ounce, and our weekly CoT data on futures speculators’ positions extends back farther to January 1999. Speculators’ bearish bets on silver in early November of 70.0k contracts was the highest ever seen since at least then. I suspect it was an all-time record high! Speculators had likely never been more bearish, never more leveraged against silver. But since silver’s swoon was relatively mild compared to that mammoth futures selling, there had to be great latent investor demand out there absorbing that torrent of supply. The fact that investors were quietly buying when everyone was convinced silver was doomed is super-bullish. Their ranks and capital inflows will swell dramatically as gold continues mean reverting back up to far-higher normal levels. And speculator futures buying is going to fuel the early gains before investors fully take the baton in silver’s next mighty upleg. Since silver futures are so highly leveraged, selling them short is an exceedingly-risky bet. Today the CME Group only requires margin of $6500 on deposit for each silver-futures contract speculators hold. But at $17 silver, a 5000-ounce contract is worth $85,000. That’s leverage of 13.1x! Stock speculators have been legally limited to 2-to-1 leverage since 1974, 13 to 1 is crazy. Speculators who run minimum margin will lose 100% of their capital risked if silver merely moves 7.6% against their bet. And silver’s super-volatile history shows it doesn’t take long, a day or two, for such big swings to erupt. This risk is particularly acute for the speculators short silver, since they legally have to buy to cover. Shorting requires speculators to effectively borrow silver before they sell it, with the hope of buying it back later at lower prices to repay their debts. The only way to settle those debts is to close their short contracts by buying offsetting longs . This buying is compulsory as silver rallies and erodes their capital risked, so they quickly buy to cover. And as you can see, the short covering has already been fast and furious. But it’s not over yet! In the latest CoT week, speculators were still short 35.9k contracts. This remained well above their average short levels of 21.5k in the normal years between 2009 to 2012. So merely to mean revert to those norms, not even overshoot in the other direction which is always the case after extremes, they still have to buy to cover another 14.4k contracts. That equates to another 72.1m ounces of buying! Meanwhile the long-side speculators will get more bullish and bold as silver rebounds, partially on short covering. They will ramp up their bets again, inevitably pushing their total contracts back up near long-side uptrend resistance around 93k contracts. That would require 17.5k contracts of buying, or another 87.4m ounces. And don’t forget the 39.8m or so likely coming from stock traders through SLV very soon. Add speculator short covering, long contracts rebounding, and stock-investor SLV buying, and silver is looking at potential near-term buying over the coming few months of a staggering 199.3m ounces! That is the equivalent of nearly 4/5ths of the entire silver investment demand for all of 2013. The potential silver upleg that much buying in a relatively short period of time would fuel is massive. Silver is truly ready to run. And really that’s just the start. Traditional silver investing doesn’t come through silver futures or ETFs, but through physical bars and coins. And once the futures buying and ETF buying pushes silver high enough for long enough to convince investors this new upleg is the real deal, traditional physical demand will soar and take the baton. Futures and ETF buying really just jump starts the even-larger main show. With silver’s prospects out of its recent extreme lows looking so incredibly bullish, all investors need to get silver exposure in their portfolios. Physical silver bars and coins, and even SLV, are fine ways to do it. But their upside is limited to silver’s gains, they can’t leverage it. Meanwhile the best of the silver miners’ and explorers’ stocks will amplify silver’s upleg by multiples, potentially earning fortunes for investors. The bottom line is silver is ready to run higher in a major new upleg. Silver is ultimately driven by gold’s fortunes, so as gold continues mean reverting higher silver is going to catch a massive bid. This buying will initially come from American stock traders and futures speculators. They will aggressively buy SLV shares faster than silver is being bought, cover still-large silver-futures shorts, and add new silver-futures longs. This major buying, likely to approach a couple-hundred million ounces in a matter of months, will serve to launch silver higher. And nothing attracts investors like rallying prices, so global investment demand will ramp dramatically. Investors are so underexposed to silver after leaving it for dead in recent years that they will need enormous buying to attain any reasonable silver exposure. Silver will soar on these inflows. Additional disclosure: I’m long extensive gold-stock and silver-stock positions which have been recommended to our newsletter subscribers.