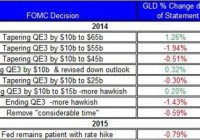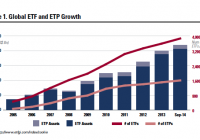
By Niall H. O’Malley of Blue Point Investment Management Before delving into the limitations and unintended consequences of Exchange-Traded Funds (ETFs) it is important to define an ETF. Where did these investment vehicles originate? How significant are ETFs to investors? The first Exchange Traded Fund was launched in January 1993 by State Street Global Advisors under the ticker symbol (NYSEARCA: SPY ). The ETF was designed to track the value of the S&P 500 Index. It is quoted at 1/10 of the value of the S&P 500. The ETF was marketed as a “spider”, shorthand for Standard & Poor’s Depository Receipt (SPDR), traded on the New York Stock Exchange. The popularity of the S&P 500 SPDR led to a family of products. Other fund management companies, such as Barclays – creator of iShares – and Vanguard, followed suit in short order and the universe of ETFs rapidly expanded. The S&P 500 SPDR is still one of the most popular ETFs. Its average volume exceeds 110 million shares on a daily basis, and its assets under management are over $171 billion. 1 How Significant are Exchange Traded Funds and Related Exchange Traded Products? As a financial innovation that is approaching its 22nd anniversary, it is fair to say Exchange Traded Funds and the related Exchange Traded Products have been revolutionary. Investors have entrusted over $2 trillion to this financial innovation. ETFs have grown in popularity since they offer investors cost effective diversification to markets, sectors, currencies and commodities. ETFs have evolved into a family of closely related investment vehicles known as Exchange Traded Products (ETPs). ETPs include Exchange Traded Notes, Leveraged ETFs, Inverse ETFs, Exchange Traded Commodity Pools, Exchange Traded Vehicles (ETV) and Active ETFs. The success of ETFs and other Exchange Traded Products is quite striking, especially when one considers the number of companies traded on the New York Stock Exchange and the NASDAQ, 6,251 2 , compared to the number of global ETFs and ETPs, 5,463. Most ETFs and ETPs are traded in the U.S. There are 1,686 ETFs and ETPs that invest in just U.S. securities and 3,777 that invest in varying levels of international securities. Over 95% of the ETFs and ETPs are passively managed. Once the exchange traded basket is established the composition of the ETP is on autopilot, i.e. it is not actively managed. Note: Exchange Traded Products is often used as an umbrella term. In the chart above Exchange Traded Funds growth is detailed in the top line and growth in other exchange traded structures is detailed in the bottom line. What Are Some of the Benefits of ETFs? Cost Effective Diversification The primary strength of Exchange Traded Funds is the cost effective passive diversification they offer an investor. As an example, exposure to the S&P 500 Index can be gained through the purchase on one share of the S&P 500 SPDR ETF rather than purchasing 500 separate securities. The expense ratio for the S&P 500 SPDR is 0.09% which is very low. The average institutional ETF expense ratio is 0.562%. ETF holdings vary widely from less than 10 securities to over 16,000 securities. An ETF, like a mutual fund, pools the assets of multiple investors; however, ETFs tend to be significantly less expensive and offer instantaneous pricing information during the trading day rather than once daily pricing as is the case with mutual funds. Each share in an ETF represents an undivided interest in the underlying securities less the expense ratio. To understand the pricing variations, an investor has to factor in the type of ETF. An additional consideration with mutual funds is the share class and whether a sales fee is taken. When considering mutual funds, the investor also needs to factor in the fee structure. The table below provides insight into the expense ratio variations in open end funds. Both mutual funds and ETFs are considered open-end funds, i.e. there is no limitation on the number of shares that they can issue. You will notice in the table below that passive ETFs do not have mutual fund sales commissions referred to as front-end load/ No load and back-end load/ level load. Deep Liquidity for Popular ETFs The larger ETFs offer deep liquidity, e.g. the iShares MSCI Emerging Markets ETF (NYSEARCA: EEM ) – founded by Barclays and now managed by BlackRock – has an average daily volume that exceeds 60 million shares and assets under management exceed $36 billion. However, not all ETFs are highly liquid. In fact, liquidity varies widely among ETFs. Important liquidity considerations are the average trading volume, assets under management, plus the strength of the counterparties – authorized participants – that create and redeem the ETF shares. Another consideration is the complexity of the ETF in terms of the number of securities held. Each security is dependent on a functioning market for price discovery which can be interrupted by trading halts and “flash crashes”. New Investment Approaches Investors, both individual and institutional, can use ETFs to gain rapid, cost effective diversification to markets, sectors and various strategies, e.g. growth and/or value. The explosion of the ETF universe has expanded the toolset available to investors. A popular investment approach is a combination of active and passive investing. Investors may also take an active management approach incorporating individual securities or actively managed funds. This is referred to as “seeking alpha”. The investor is seeking a return above the market return represented by market indexes. Some investors prefer to pursue a purely passive approach with ETFs and ETPs which limits down side risk offering a weighted average return. What are Some Limitations and Unintended Consequences of ETFs? Short-term Trading, Taxes and Lower Realized Price Perhaps the biggest ETF limitation is behavioral. ETFs are credited with being less work. All an investor has to do is buy the basket of securities represented by an ETF and the benefits of diversification are gained. While it is true that ETF investing involves less work, it creates an unintended consequence of creating less conviction in the face of adversity – a market selloff. This increases the chance that the investor will become more reactive and short-term oriented. For taxable investors, this introduces the higher short-term capital gains rate. It is important to note that taxes are not the only cost. A potentially even greater cost is incurred when an investor sells during a market selloff and realizes a loss. Performance Limitation – The Best Return is an Average/Weighted Average Return If you had a child, would you encourage them to get Cs in school? The frequent encouragement from parents is to seek As and Bs. Why does the same rule not apply to your investments? How often does an index double? The answer is not that often. When an investor invests in an ETF, it is important to realize that they are electing to receive an average return for the invested amount. An average grade in school is a C. The return of an ETF is the weighted average of the underlying securities less the expense ratio. In short, while the ETF assets benefit from diversification there is a performance limitation. A Less Transparent Issue – Tracking Error & Counterparty Risk An ETF’s market price can trade at a premium or a discount to the value of its underlying securities. Wider bid/ask spreads occur when an ETF or security is thinly traded which creates additional investment costs. The creation and redemption of ETF units is dependent on counter parties that are referred to as authorized participants. An ETF fund manager enters into contractual relationships with one or more authorized participants. Authorized participants create ETF fund shares in large increments – typically 50,000 fund shares. The authorized participant or participants seek to minimize pricing differences between the market value of underlying ETF securities and the net asset value of the ETF. Authorized participants seek to arbitrage the pricing differences but are dependent on functioning markets and stability of their broker dealer operations. Flash crashes and other market disruptions associated with high frequency trading arbitrage can create tracking error. Structure Risk As the popularity of ETFs has grown, it has given way to an alphabet soup of Exchange Traded Products which include alternative ETFs, Exchange Traded Notes (ETNs), alternative ETFs, exchange traded vehicles (ETVs), exchange traded commodities or currencies (ETCs), and other types of structures. It is important to note that the product structures of the newer ETPs in turn create unique risks for investors. From a structure and regulatory perspective, ETFs are open-ended investment companies that offer investors an undivided interest in the underlying securities of the fund less expenses. The same is not true with Exchange Traded Notes (ETNs). An an ETN is just a credit obligation from the issuer, i.e. there is no collateral. The credit obligation is only as good as the balance sheet of the issuer. This became a painful lesson for investors in the Lehman Brothers ETN products as they did not own the underlying collateral, and therefore, became unsecured creditors in the Lehman bankruptcy. Alternative ETFs give investors the potential to invest in investment options that are leveraged and/or inversely correlated to its index benchmark. Typically, alternative ETFs are designed to generate daily returns that are a positive or negative multiple of its benchmark, e.g. stock indexes, currencies and commodities. The math of daily settlements introduces the risk of significant tracking error, and introduces a tax liability that does not exist with traditional ETFs. The primary collateral for alternative ETFs are the derivative contracts and money market instruments used to create the leveraged or inverse exposure. Local Firm Participation A Bethesda, Maryland firm, ProShares, is the world’s largest provider of leveraged and inverse ETFs. ProShares has grown from one fund in 2006 to over 145 alternative ETFs. Another Bethesda, Maryland, based firm is AdvisorShares which offers 28 actively managed ETFs. Actively managed ETFs were first approved by the Securities and Exchange Commission in 2008. The actively managed ETF adds an active management component to the ETF structure that has otherwise been passively managed. T. Rowe Price has received regulatory approval to issue actively managed ETFs. Legg Mason has also received approval from the Securities and Exchange Commission to begin issuing actively managed ETFs. Investment Considerations Before making any investment, it is important to identify your goals and understand the limitations and opportunities associated with the investment you are considering. Do you want the weighted average return? Faced with a market selloff do you have conviction about your investment? Are you familiar with the fund manager? What is the underlying collateral? Exchange Traded Funds and Products have expanded the investable universe for investors. One of the most important benefits that ETFs and ETPs offer is their ability to diversify a portfolio. This is especially true in emerging and developing markets where investment options may not otherwise be accessible. Whether investing in an ETP or a listed company, it is important to research your investment. Due diligence is a key consideration that should not be overlooked whether investing passively, actively or in a blended approach. Sources: – https://www.spdru.com/?internalR edirect=https%3A%2F%2Fwww. spdru.com%2F&_new_user=1#/ content/debunking-myths-and-common-misconceptions-of-etfs – https://www.spdru.com/?internalR edirect=https%3A%2F%2Fwww. spdru.com%2F&_new_user=1#/ content/9-questions-every-etf-investor-should-ask-before-investing – https://www.fidelity.com/learningcenter/investment-products/etf/ drawbacks-of-etfs – http://www.forbes.com/sites/ rickferri/2013/09/02/etf-fees-creephigher/ – https://www.fidelity.com/ viewpoints/active-trader/no-stopping-ETFs – http://www1.nyse.com/about/listed/ nya_characteristics.shtml – http://www.lipperweb.com/ Research/Fiduciary.aspx – http://etfdb.com/compare/marketcap/ – http://www.ici.org/pdf/per20-02.pdf – http://www.etfgi.com/index/cookie Endnotes : 1 ETF Database Top 100 ETFs by Assets 10/16/14 NYSE 3,296 and NASDAQ 2,955 as of 10/16/14 2 ETFs 3,868 and 1,595 ETPs