Tag Archives: latest-articles

Parkit Enterprise Inc.: Pay Discount On Parking Assets, Get Asset Management With Significant Multi-Bagger Potential For Free

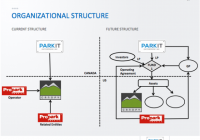
Summary Parkit is a rare opportunity to own a start-up asset manager that is likely to raise significant capital in 2015 to execute on their strategy. Parkit and ProPark combine to create a competitive advantage and have a track record of success which shall help raise capital. Management is extremely bullish and CEO has been buying on the open market extremely consistently at prices higher than today. Shares trade at a significant discount to NAV and investors get the asset management business for free. We see multi bagger potential. (Note: Parkit is also traded on the Canadian TSX Venture Exchange under the ticker PKT.V. Volume on the Canadian exchange is greater than on the OTCQB shares.) We are continuously looking for a business with quality economics run by incentivized managers and where the market is getting the risk/reward ratio very wrong. Strong downside protection is absolutely paramount as the upside will take care of itself with upcoming catalysts. To find such an opportunity in a frothy market such as today one must be willing to search through some obscure places. For 2015, we will be closely following a small parking garage owner based in Canada called Parkit Enterprise Inc. (OTCQX: PKTEF ). The company owns equity in two US off-airport parking garages and has been working on transitioning to becoming a fund manager that aggregates high quality income producing parking assets via a private equity platform. We think the market is serving up a very attractive opportunity as it is extremely rare for the investing public to have the ability to invest in an emerging asset manager. Most often those opportunities are only available to employees or private equity investors. Even rarer is that Parkit already has a track record, has operating assets and is cash flow positive. Currently trading at a discount to NAV on the company’s current owned parking assets, we think the low US$0.40s (mid CAD $0.40s) is a very cheap price to pay for Parkit and does not at all account for the upside potential as a fund manager of quality parking lots. We will be watching Parkit very closely as capital is raised for their first fund over the next few quarters. Management has significantly raised their guidance on funds they will be able to raise and if properly executed, this company is worth many multiples today’s price. History and Fund Manager A Long Time Coming In years past, Parkit was originally called Greenspace and previous management before 2012 did not have a coherent strategy. They helped greenfield the construction of the Canopy parking garage located right outside Denver International airport (completed in 2010), but they ran a bloated cost structure which ultimately almost led to the company going broke even as Canopy performed well. To help transition the company into a leading parking industry company, they brought on Rick Baxter as CEO, some other talented managers and a board of directors with the private equity experience to turn the ship around and execute on an asset manager strategy. Since 2012 when management changes occurred, the company has paid down debt, set the platform for the company’s new fund management strategy and did this while management did not pay themselves for a year and a half. Management decided to take the compensation that accrued to them and roll that over as equity into the company. Unwarranted Recent Price Dive You would expect the market to be reacting positively to Parkit’s turnaround and future prospects, which it did to some degree in April after the announcement of the Expresso acquisition; however, shares have been falling from a high of $0.70 in both the Canadian and US listed shares since October. We think that the market is overreacting to the combination of the oil sell off and the recent resignation of John LaGourgue, VP of Corporate Communications, who was extremely bullish on the company’s long-term prospects. We think that the oil price drop does not change the investment thesis and actually could increase drivers’ interest to travel and park in parking lots. Also, LaGourgue left for personal reasons and as a sign of interest in the company’s long-term prospects he continues to keep 85-90% of the shares and options in Parkit. Keep in mind, many of his shares were purchased on the open market and that he likely sold some shares to diversify his investments. Business Current And Going Forward (click to enlarge) (Source: Parkit Presentation) Parkit has been operating in the past and currently under the model to the left. Parkit owns an equity stake in the Canopy and Expresso garages alongside ProPark America and a few other outside investors. Parkit does not operate these assets, ProPark America provides those services as that is within their circle of competence. Previously Parkit did not bring too much to the relationship other than the capital to invest into Canopy, but that is changing drastically as the new strategy emerges. Parkit’s new strategy is to, to put it simply, set up and run a parking garage private equity fund not too different from an asset manager in structure. As seen in the chart above and to the right, Parkit has already set up a fund with ProPark to act as a platform to raise institutional money to then be used to aggregate parking assets that both Parkit and ProPark manage. Parkit and ProPark both are General Partners (50:50 split) and will receive hedge fund like management fees (0.5-1% of AUM), acquisition fees ( Additional disclosure: This article is meant for instructional purposes and not meant as a recommendation to buy or sell. We are human and can be wrong, especially with our forecasts, so it is extremely important to do your own homework. The only kind of intelligent investing is through your own due diligence. We own both PKTEF and PKT.V.

SCHA Looks Like A Nice Complimentary Holding To Enhance A Diversified Portfolio

Summary I’m taking a look at SCHA as a candidate for inclusion in my ETF portfolio. The expense ratio relative to the diversification is fantastic. The moderate level of correlation to major funds helps SCHA find a place. I wouldn’t consider SCHA as a core holding, but I may choose it for 5% to 10% of the portfolio. I’m not assessing any tax impacts. Investors should check their own situation for tax exposure. Investors should be seeking to improve their risk adjusted returns. I’m a big fan of using ETFs to achieve the risk adjusted returns relative to the portfolios that a normal investor can generate for themselves after trading costs. I’m working on building a new portfolio and I’m going to be analyzing several of the ETFs that I am considering for my personal portfolio. One of the funds that I’m considering is the Schwab U.S. Small-Cap ETF (NYSEARCA: SCHA ). I’ll be performing a substantial portion of my analysis along the lines of modern portfolio theory, so my goal is to find ways to minimize costs while achieving diversification to reduce my risk level. What does SCHA do? SCHA attempts to track the total return of the Dow Jones U.S. Small-Cap Total Stock Market Index. At least 90% of funds are invested in companies that are part of the index. SCHA falls under the category of “Small Blend”. Does SCHA provide diversification benefits to a portfolio? Each investor may hold a different portfolio, but I use (NYSEARCA: SPY ) as the basis for my analysis. I believe SPY, or another large cap U.S. fund with similar properties, represents the reasonable first step for many investors designing an ETF portfolio. Therefore, I start my diversification analysis by seeing how it works with SPY. I start with an ANOVA table: (click to enlarge) The correlation is about 90%. This is a fairly moderate correlation. It’s low enough that we have a chance at lowering the risk level of a total portfolio so long as the standard deviation is not too high. Standard deviation of daily returns (dividend adjusted, measured since January 2012) The standard deviation isn’t great, but it is acceptable. For SCHA it is .9294%. For SPY, it is 0.7300% for the same period. SPY usually beats other ETFs in this regard, so that isn’t a major issue. Mixing it with SPY I also run comparisons on the standard deviation of daily returns for the portfolio assuming that the portfolio is combined with the S&P 500. For research, I assume daily rebalancing because it dramatically simplifies the math. With a 50/50 weighting in a portfolio holding only SPY and SCHA, the standard deviation of daily returns across the entire portfolio is 0.8094%. If we drop the position to 20% the standard deviation goes down to .7559%. In my opinion, that’s still too high. Once we drop it down to a 5% position the standard deviation is .7357%. If I include SCHA, I would probably seek to use an exposure level around 5%, but could potentially go as high as 10%. Why I use standard deviation of daily returns I don’t believe historical returns have predictive power for future returns, but I do believe historical values for standard deviations of returns relative to other ETFs have some predictive power on future risks and correlations. Yield & Taxes The distribution yield is 1.43%. The SEC yield is 1.30%. In my opinion, these yields make the index less appealing for a retiring investor, but an argument could still be made for a position as large as 5% because of the correlation being down to almost 80%. I’m not a CPA or CFP, so I’m not assessing any tax impacts. If I were using SCHA, I would want it to be in a tax exempt account to remove any headaches associated with frequent rebalancing. Expense Ratio The ETF is posting .08% for an expense ratio. I want diversification, I want stability, and I don’t want to pay for them. The expense ratio on this fund is still within my comfort range. This expense ratio is lower than SPY, but higher than (NYSEARCA: SCHX ). SCHX is an alternative to SPY that I found more appealing. Market to NAV The ETF is at a .07% premium to NAV currently. I’m not thrilled about that, but it isn’t terrible. However, premiums or discounts to NAV can change very quickly so investors should check prior to putting in an order. Largest Holdings The portfolio is wonderfully diversified. The largest position is extremely short duration bonds at .67%. I suspect the ETF is using this as a method for storing dry powder rather than holding cash. That would be a fine solution in my book and I don’t mind seeing it in the portfolio as long as it is less than 1% of assets. I don’t want to be paying an expense ratio on a significant amount of funds that are not invested. For the real investments of the fund, the vast majority are under .30%. This is spectacular diversification and it is remarkable to find this with an expense ratio of only .08%. (click to enlarge) Conclusion I’m currently screening a large volume of ETFs for my own portfolio. The portfolio I’m building is through Schwab, so I’m able to trade SCHA with no commissions. I have a strong preference for researching ETFs that are free to trade in my account, so most of my research will be on ETFs that fall under the “ETF OneSource” program. So far, I like SCHA for exposure to the smaller capitalization side of the market. The moderate correlation helps to mitigate the higher standard deviation of returns and makes this ETF look like a nice fit for a small portion of the portfolio. For me, that’s 5 to 10%. I’d be concerned about investors considering it a core asset and putting in 20% or more, but it looks like a nice piece for that small position in the portfolio. Additional disclosure: Information in this article represents the opinion of the analyst. All statements are represented as opinions, rather than facts, and should not be construed as advice to buy or sell a security. Ratings of “outperform” and “underperform” reflect the analyst’s estimation of a divergence between the market value for a security and the price that would be appropriate given the potential for risks and returns relative to other securities. The analyst does not know your particular objectives for returns or constraints upon investing. All investors are encouraged to do their own research before making any investment decision. Information is regularly obtained from Yahoo Finance, Google Finance, and SEC Database. If Yahoo, Google, or the SEC database contained faulty or old information it could be incorporated into my analysis. The analyst holds a diversified portfolio including mutual funds or index funds which may include a small long exposure to the stock.

The Case For Maintaining A Strategic Allocation To Real Assets

As investors continue to look for ways to diversify their portfolios away from traditional long-only stock and bond investments, real assets have become a popular alternative asset class. In fact institutional investors, such as leading endowments and foundations, have long used investments in real assets such as real estate, commodities, timber and energy as both a hedge against inflation and as a core diversifier. To provide more insight into this asset class and how institutional investors are using real assets, Michael Underhill, chief investment officer of Capital Innovations and a leading manager of multi-asset real return portfolios, answers a few questions for us on the topic. Given the increase in regional conflicts and greater overall geopolitical risks today, how is this influencing your respective portfolio positioning from both a macro and micro perspective? As geopolitical risks rise we would expect higher volatility in markets, increased risk of supply shocks to key commodities such as oil and food and a discounting of potential higher inflation and subsequent higher interest rates. As a hedge to these types of macro risks, exposure to real assets, and their relative inflation hedge qualities would become more attractive. Positioning on a more micro level we are incorporating these geopolitical risks and have been reducing our relative portfolio weighting in more interest rate sensitive groups such as electric utilities and telecomm and increasing more inflation hedge real assets such as energy, timber, agricultural commodities. What are the risks that investors should think about hedging or mitigating today and why? A common mistake investors make is to extrapolate current environment out too far and become complacent. The current environment of low interest rates, low inflation, and low volatility has afforded the opportunity to hedge the risk that this environment changes over the investment horizon. Do you want to bet that this backdrop we have had since the financial crisis does not change? The ideal time to add real asset exposure is when not many are thinking about it – buy an umbrella when the sun is shining. If we examine an allocation to real assets over the past 24 years, as shown in the chart below, we can see improved portfolio efficiency, with enhanced returns and lower volatility. Historical Effect of Allocating to Commodities (January 1980- July 2014) What are the opportunities investors should be seeking exposure to and why? In 2015, we expect improved global growth and a mid-year increase in US interest rates. The ECB and the BOJ remain in easing mode, and the policy outlook in the rest of the world varies considerably. The risk that global growth remains sluggish is high, and a lack of meaningful improvement could lead to a sharp increase in the dollar and a significant reorientation of capital flows. Most regions should see decreasing growth headwinds in 2015, although geopolitical uncertainties, volatile oil prices, and moderating Chinese growth remain concerns. It is for these reasons that we continue to advocate for a diversified, tactically managed, multi-asset portfolio that seeks to generate returns in excess of the actual rate of inflation and provides managed volatility rather than a single-asset-class solution. A broad range of real asset equity securities, including emerging markets and commodities, real estate investment trusts, and directly held positions in master limited partnerships. How does a global multi-asset real return strategy fit into a liability driven investing framework? The tangible properties of a real asset allow its price to fluctuate with overall market prices of physical assets. Real assets tend to be sensitive to inflation because of their tangible nature. Examples of real assets include direct investment in real estate, commodities, precious metals, timber, energy, farmland, precious metals, commodity-linked stocks, and commodity-linked hedge funds. Most investors are more familiar with investments in financial assets, which are contractual claims that do not generally have physical worth. In an LDI platform, real assets provide potential reductions in surplus volatility to the extent that real asset movements are not highly correlated to movements of financial assets. Returns from real assets may also boost returns since real assets are generally not as efficiently priced as the more competitively priced stocks and bonds. The return potential for real assets has become especially attractive in recent years since stocks and bonds have not performed well. From a risk management perspective, a key benefit from expanding asset classes to include real assets rests on correlations. A group of assets that have high correlations with each other but have low correlations with other groups of assets represent an asset class. There tends to be much less diversification potential from combining assets within an asset class than from combining assets from different asset classes. Real assets represent such a broad asset class that a wide range of correlations exist both within the asset class and with assets from other asset classes, allowing for attractive diversification. Our clients have found that the best performance comes from avoiding the large losses that markets often impose on passive investment portfolios. This tends to be especially important for real assets. As a first step we look behind the market consensus and identify where herding and overreaction phenomena may be at work. These phenomena occur both within and across asset classes. We perform extensive modeling with sensitivity analysis to find our best risk management strategy for an LDI structure. From there we model our best set of segments within an asset class and simulate the surplus volatility and return. This is not just simple quantitative analysis because we must also build in forward looking scenario planning. We track actual LDI performance against expected LDI performance. This type of tracking is revealing in that we can review what we were expecting when the allocations were set and identify where things developed differently. This type of learning over many years of experience is very helpful in building analysis skills.