Tag Archives: latest-articles

Pigs In China – A Longer-Term Reason To Like Corn

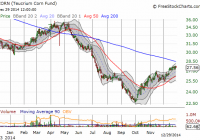
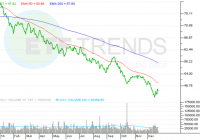
The Teucrium Corn ETF finally seems to be bottoming although technical challenges remain overhead at the 200-day moving average. China’s massive consumption of pig meat creates tremendous demand for imported soy beans and corn to feed these pigs. Assuming this demand for pigs is sustainable, it promises to support corn prices, and thus dip-buying in Teucrium Corn ETF, over the longer-term. After an additional dip, my thesis for playing another bottom in Teucrium Corn ETF (NYSEARCA: CORN ) seems to finally be working. Since that article in mid-August, CORN is up 5.3% versus a 6.0% gain in the S&P 500 (NYSEARCA: SPY ). However, on the way to this gain, CORN first lost as much as 13%…so the ETF has a lot of work to do to balance out risk and reward. The next challenge for Teucrium Corn ETF : a downtrending 200-day moving average (DMA) Source: FreeStockCharts.com As I continue to patiently wait for this trade to unfold, I occasionally check in on relevant news to support or refute the thesis of a supply correction coupled with on-going strength in demand. One of the more fascinating pieces I have read along these lines comes from the Economist on December 20, 2014 titled ” Swine in China: Empire of the pig .” Before reading this piece, I had almost no understanding of the pig’s importance in Chinese history and diet. China’s increase in wealth in recent decades has simultaneously encouraged a massive increase in the consumption of pig meat: Since the late 1970s, when the government liberalised agriculture, pork consumption has increased nearly sevenfold in China. It now produces and consumes almost 500m swine a year, half of all the pigs in the world. This increase has brought a whole host of challenges to China’s government, farmers, and society as a whole. There are even environmental threats reaching into other countries. Since pig feed mainly consists of soy beans and corn (food scraps off the family table have long ceased being sufficient!), China’s demand for these crops has soared along with pig consumption. China cannot feed all its pigs and thus relies on imports. The International Institute of Social Studies in The Hague estimates… …more than half of the world’s feed crops will soon be eaten by Chinese pigs. Already in 2010 China’s soy imports accounted for more than 50% of the total global soy market. The kicker for corn comes from the trade organization, the US Grains Council: …by 2022 China will need to import 19m-32m tonnes of corn. That equates to between a fifth and a third of the world’s entire trade in corn today. China’s need for pig feed is so great that the International Institute for Sustainable Development claims China has (discreetly) purchased 5m hectares in developing countries for farming purposes. The Economist notes that, when Shuanghui, China’s largest pork producer, bought Smithfield Foods, an American firm, in 2013, it acquired huge stretches of Missouri and Texas. While the sustainability of China’s pig consumption is far from clear, it appears that China will imminently help pressure corn markets over the long-term. Along with this strength comes support for prices over time – the kind of support that makes dip-buying particularly attractive. The China/pig factor provides additional (and important) context to the on-going insistence from Deere’s CEO that corn prices will come back. Be careful out there!

When To Rebalance Your Portfolio

It’s that time of year again. Time to look at your portfolio and decide on your rebalancing strategy. Most investors know they should rebalance but many don’t do it or they get hung up on the detailed mechanics of rebalancing. In this post I’ll present a quick summary of rebalancing approaches and share my approach as well. We rebalance portfolios to improve risk adjusted returns over the long haul. In general, if portfolios are not rebalanced then the equity portion of the portfolio grows to dominate the overall portfolio and its risk. This is usually not something investors want especially as they age. After the decision to rebalance, the next question is how often. The frequency of rebalancing has to be traded off with the costs of rebalancing, transaction fees, commissions, etc… We also need to consider if we should rebalance if there is any difference at all in our target percentage allocations or wait until there is a significant enough difference to trigger an allocation decision. Say your target is 60% stocks and at the end the year you end up at 61% stocks. Does the benefit of rebalancing outweigh the costs? Probably not in this case. So, how does an investor choose the best approach? Fortunately, the great folks at Vanguard have done all the heavy lifting for us in this paper. Here is the summary table. (click to enlarge) As the above table shows basically there is not a big difference in rebalancing approaches, outside of never rebalancing. Even a monthly rebalance with a 0% threshold does not increase portfolio turnover and costs as much as you would expect. The last column also shows the results of never rebalancing – higher returns but with significantly higher volatility which leads to portfolio outcomes that most investors cannot stick with over time. These results also hold for quant portfolios. Whether implementing the IVY portfolios, the Permanent portfolios, Quant portfolios, the timing and threshold of the rebalance does not make a significant difference to long-term portfolio returns, e.g. see the IVY portfolio FAQ question #4. However, it is important to point out that there are periods where rebalancing does not work. Let me give you an example. The table below compares the returns of 60/40 stock bond and 70/30 stock bond portfolios with yearly rebalancing and no rebalancing over the last 5 years (2009 to 2013). (click to enlarge) As the table shows, yearly rebalancing increased returns for the 60/40 portfolio but yearly rebalancing actually decreased returns for the more aggressive 70/30 portfolio. This is typical in strong bull markets when stocks consistently outperform. This is maybe one of the reasons investors abandon rebalancing. But it is important to focus on the long term and more importantly on risk adjusted returns and stick to a rebalancing strategy. Personally, I rebalance once a year with a 1% threshold across all my portfolios regardless of strategy. But that is what I have found works for me. The best advice I can give anyone is to paraphrase the Vanguard advice – choose a regular periodic rebalancing approach that fits your investment style and that you can stick with over the long haul. This is most likely my last post for this year. Hope everyone has a Happy New Year! Here is to a great and prosperous 2015. At the beginning of the year I’ll be focusing on updating all the yearly returns for all the portfolios and strategies I track. I’m looking forward to sharing the results with everyone.

ETFs To Hedge Treasuries As Traders Go Short

Summary U.S. Treasuries had a great year. Bond traders are now growing wary, increasing shorts against Treasuries. Aggressive traders who have a bearish outlook on Treasuries can consider inverse leveraged ETF options. Bond investors are growing increasingly bearish on Treasuries futures. Exchange traded fund traders can also hedge against a fall in the Treasuries market through inverse products. For instance, the ProShares UltraShort 20+ Year Treasury (NYSEARCA: TBT ) seeks to deliver twice the daily inverse performance of the Barclays Capital US Treasury 20+ Year Treasury Bond Index. TBT has increased 3.4% over the past week but is still down 39.5 year-to-date. TBT’s triple- leveraged cousin, the Direxion Daily 20-Year Treasury Bear 3X ETF (NYSEARCA: TMV ) , has increased 4.7% over the past week but declined 54.3% year-to-date. Bond investors are building on what some are calling the largest short position ever in Treasury futures, reports Patti Domm for CNBC . Specifically, George Goncalves, head of rate strategy at Nomura, estimates that there are some $29 billion in shorts across the Treasury futures complex, the highest post-financial crisis level. Adrian Miller, director of fixed income strategy at GMP Securities, also pointed out that there were 258,000 net short positions for 10-year futures on December 16, the second largest ever behind May 2010. In comparison, there were only 75,000 net shorts as of November 25. “We started rolling into better data, and then we had the employment report. That probably quickened the trade,” Miller said in the article. “We can debate all day long how much rates are going to rise… At the end of the day, it’s still going to be a rising rate environment.” Along with higher rate expectations in anticipation of the Federal Reserve eventually hiking rates, the market is also positioning for other events, like the European Central Bank easing. “We’ve got the ECB meeting Jan. 22. The first week of January we get all of the European inflation data. That’s going to really set the tone,” Goncalves said in the article, arguing that the market sees a chance that the ECB could reveal a quantitative easing program. ProShares UltraShort 20+ Year Treasury (click to enlarge) Max Chen contributed to this article .