Tag Archives: latest-articles

Residential REITs ETF Could Slow As Renters Turn Into Buyers

Summary The residential REIT ETF was this year’s best performing financial services fund. However, residential REITs could slow down next year. Rental costs are rising, which in turn could force more renters to buy homes. The residential real estate investment trust exchange traded fund may be this year’s best financial services fund, but things may slow down next year as younger Americans find cheaper financing for a new home. The iShares Residential Real Estate Capped ETF (NYSEArca: REZ ) has increased 37.7% year-to-date as Americans opted to rent instead of purchase a new home this year. REZ offers investors a liquid alternative to physically owning commercial real estate. To qualify as a REIT, a real estate firm has to pay out the majority of its taxable income to shareholders as dividends, and REZ generates its income through renters. Since REITs pay out income to investors, REZ also shows a decent 3.21% 12-month yield. In 2014, U.S. renters paid a collective $441 billion in rent, up $20.6 billion, or 4.9%, from 2013 as renters in San Francisco paid over 14% more in rent, renters in Denver paid 11% more and New Yorkers paid over 10% of all the rent paid in the country, reports Diana Olick for CNBC . Zillow Chief Economist Stan Humphries said in the CNBC article: Over the past 14 years, rents have grown at twice the pace of income due to weak income growth, burgeoning rental demand, and insufficient growth in the supply of rental housing. Next year, we expect rents to rise even faster than home values, meaning that another increase in total rent paid similar to that seen this year isn’t out of the question. In fact, it’s probable. Consequently, the sudden rise in rents could force renters to become new homeowners, especially with cheaper loans available. Specifically, Fannie Mae and Freddie Mac have announced low-down payment loans and mortgage rates are also still attractive. Currently, Fannie Mae and Freddie Mac implement a minimum 5% down payment on home loans. However, the lenders could change it to a 3% minimum, which would allow creditworthy but cash-strapped consumers to acquire a new home. Additionally, mortgage rates remain depressed after Treasury bond yields made a surprising turnaround this year, with benchmark 10-year yields down to 2.2% compared to about 3.0% at the start of 2014. Zillow’s Humphries added: As we prepare for New Year’s and the next home shopping season, we expect soaring rents to entice more people to the relative stability of home ownership, particularly younger potential buyers. iShares Residential Real Estate Capped ETF (click to enlarge) Max Chen contributed to this article .
A Few Reasons To Remain Invested In American Electric Power

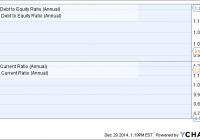
Summary American Electric’s fundamentals and valuation are favorable. American Electric is employing a number of strategies to improve its operational efficiency, and is also expected to invest aggressively in infrastructure projects. American Electric is expected to grow at a faster rate than the industry average. Electric utility company American Electric Power (NYSE: AEP ) has turned out to be a profitable investment so far this year. The company’s stock has done better than the S&P 500 index, gaining 28% so far. But, the god thing is that American Electric still remains a good investment due to its strong fundamental position and sound strategies that will help it improve further. Fundamentals are strong Trading at 16.33 times last year’s earnings, American Electric is cheaper than other players in the industry. Moreover, in the future, it is expected that the company will see better growth in its bottom line. In the previous five years, American Electric has clocked an annual earnings growth rate of 4.81%, and in the next five years, the growth rate is expected to improve to 5.2%. In comparison, the broader industry’s earnings are expected to improve at a rate of just 1.23%. Hence, American Electric is expected to grow at a faster rate than its peers. In addition, American Electric’s cash flow and dividend are appealing. The company carries a yield of 3.60% at a payout ratio of 55%. Now, since its bottom line growth is expected to be strong, it should be able to sustain the dividend. Moreover, American Electric has generated impressive cash flow numbers in the past twelve months. Its operating cash flow stands at $4.8 billion, while levered free cash flow is $287 million. As such, American Electric is in a fundamentally strong position considering the above argument. Strategies are sound Going forward, the company’s strategies should ensure that it continues to get better. American Electric Power is executing on its plan of expanding the transmission business model, and it is allocating an extra $100 million of incremental capital in 2014 for the model. Looking ahead, American Electric has approximately $2 billion of incremental transmission projects that will be executed in the coming four years. Also, to make operations more efficient, American Electric has deployed trucks at the Cardinal Plant for loading the entire welding materials at one place, and thus saving much of the time to transport and get inventory for parts. The time saved can be utilized in attending to tube leaks and alternate areas to get back the generation quickly. At the South Ben storage yard, it is simplifying and organizing storerooms and toolkits for improving the work times. The creation of new documents by the engineering group will also allow for accelerated response for projects to its customers for enhancing the customer experience. In addition, the Cook Nuclear plant is undergoing a first of its kind LEAN activity, and American Electric has already reduced the duration for targeted re-fueling, along with the costs related to it. Hence, the company is focused on reviewing several processes to eradicate redundant activities, along with the ones that fail to add value. Also, American Electric has evaluated a barge unloading system at the Amos Plant, which has resulted in an estimated investment of $6 million. It is estimated that this move will reduce coal costs by $10 million per year. Moreover, the company has decided to wash the flagging vests in the APCo Charleston area, thus saving $6,000 per year for a single employee, amounting to a total of $120 million of savings for 20,000 employees of the company. Risks to consider However, there are certain risks that investors will be taking on if they invest in American Electric. First, the company has a very weak financial position. Its cash position is weak at $299 million as compared to the total debt of $19.34 billion. In addition, a current ratio of 0.70 indicates weak short-term liquidity. A look at the graphic below indicates American Electric’s financial position as compared to industry peer Duke Energy (NYSE: DUK ). AEP Debt to Equity Ratio (Annual) data by YCharts Hence, American Electric has a pretty high debt-to-equity ratio as compared to Duke, while the current ratio is also lower than Duke. As such, American Electric will need to continue growing its earnings and cash flow at a good pace in order to improve its financial position. But, the good thing is that American Electric is well-positioned to improve its earnings, as analysts expect its bottom line at a rate of 5.2% for the next five years as compared to the industry average of 1.3%. Conclusion Hence, there are a number of reasons for investors to remain invested in American Electric. The company’s fundamentals are sound, it is focused on delivering more efficiency, and it has lined up investments to make the business better. As a result, though the stock has performed impressively this year, it is likely that it can deliver more gains going forward.

CWI Has Solid Diversification In Every Way, If Investors Will Pay For It

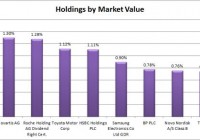
Summary I’m taking a look at CWI as a candidate for inclusion in my ETF portfolio. The expense ratio is high for my taste, but the diversification is great. The correlation to SPY is based on high trade volumes and a long sample period. I’d be cautious about entering at a premium to NAV since I don’t expect those premiums to be maintained indefinitely. I’m not assessing any tax impacts. Investors should check their own situation for tax exposure. Investors should be seeking to improve their risk adjusted returns. I’m a big fan of using ETFs to achieve the risk adjusted returns relative to the portfolios that a normal investor can generate for themselves after trading costs. I’m working on building a new portfolio and I’m going to be analyzing several of the ETFs that I am considering for my personal portfolio. One of the funds that I’m considering is the SPDR MSCI ACWI ex-US ETF (NYSEARCA: CWI ). I’ll be performing a substantial portion of my analysis along the lines of modern portfolio theory, so my goal is to find ways to minimize costs while achieving diversification to reduce my risk level. What does CWI do? CWI attempts to track the total return (before fees and expenses) of the MSCI All Country World Index ex USA. At least 80% of the assets are invested in funds included in this index, or in ADRs representing the assets in the index. CWI falls under the category of “Foreign Large Blend”. Does CWI provide diversification benefits to a portfolio? Each investor may hold a different portfolio, but I use (NYSEARCA: SPY ) as the basis for my analysis. I believe SPY, or another large cap U.S. fund with similar properties, represents the reasonable first step for many investors designing an ETF portfolio. Therefore, I start my diversification analysis by seeing how it works with SPY. I start with an ANOVA table: (click to enlarge) The correlation is moderate at 86.6%. I’d like to see a lower correlation on my international investments, but this is still low enough to provide some diversification benefits. Extremely low levels of correlation are wonderful for establishing a more stable portfolio. I consider anything under 50% to be extremely low. However, for equity securities an extremely low correlation is frequently only found when there are substantial issues with trading volumes that may distort the statistics. Standard deviation of daily returns (dividend adjusted, measured since January 2012) The standard deviation is moderately high. For CWI it is .8916%. For SPY, it is 0.7300% for the same period. SPY usually beats other ETFs in this regard, so this isn’t too absurdly high for another ETF. The combination of the high standard deviation and correlation being at 75% mean I probably won’t consider this ETF for anything more than 5% to 10% of my ETF portfolio. Liquidity looks fine Average trading volume has been high enough that I’m not concerned. The average was around 300,000 shares per day. Mixing it with SPY I also run comparisons on the standard deviation of daily returns for the portfolio assuming that the portfolio is combined with the S&P 500. For research, I assume daily rebalancing because it dramatically simplifies the math. With a 50/50 weighting in a portfolio holding only SPY and CWI, the standard deviation of daily returns across the entire portfolio is 0.7835%. With 80% in SPY and 20% in CWI, the standard deviation of the portfolio would have been .7438%. If an investor wanted to use CWI as a supplement to their portfolio, the standard deviation across the portfolio with 95% in SPY and 5% in CWI would have been .7325%. Why I use standard deviation of daily returns I don’t believe historical returns have predictive power for future returns, but I do believe historical values for standard deviations of returns relative to other ETFs have some predictive power on future risks and correlations. Yield & Taxes The distribution yield is 3.12%. The SEC yield is 2.22%. That appears to be a respectable yield. This ETF could be worth considering for retiring investors. I like to see strong yields for retiring portfolios because I don’t want to touch the principal. By investing in ETFs I’m removing some of the human emotions, such as panic. Higher yields imply lower growth rates (without reinvestment) over the long term, but that is an acceptable trade off in my opinion. I’m not a CPA or CFP, so I’m not assessing any tax impacts. Expense Ratio The ETF is posting .34% for an expense ratio. I want diversification, I want stability, and I don’t want to pay for them. The expense ratio on this fund is higher than I want to pay for equity securities, but not high enough to make me eliminate it from consideration. It is pushing that way though. I view expense ratios as a very important part of the long term return picture. Market to NAV The ETF is at a 1.09% premium to NAV currently. Premiums or discounts to NAV can change very quickly so investors should check prior to putting in an order. I wouldn’t want to pay this premium unless I could find a solid accounting justification for it. The ETF is large enough and liquid enough that I would expect the ETF to stay fairly close to NAV. Generally, I don’t trust deviations from NAV and I will have a strong resistance to paying a premium to NAV to enter into a position. Largest Holdings The diversification is fairly solid in this ETF. My favorite thing about the ETF is easily the diversification. If I’m going to be stuck with that expense ratio, I expect it to buy a fairly strong level of diversification and in this case it appears to do just that. (click to enlarge) Conclusion I’m currently screening a large volume of ETFs for my own portfolio. The portfolio I’m building is through Schwab, so I’m able to trade CWI with no commissions. I have a strong preference for researching ETFs that are free to trade in my account, so most of my research will be on ETFs that fall under the “ETF OneSource” program. I like the correlation and the diversification in the holdings, but the expense ratio is a bit high and I wouldn’t want to enter into a position at a significant premium to NAV. In my opinion, 1% is a fairly significant premium to pay with no assurance that I could exit the position at the same premium. This looks like an ETF to keep on my list as an option for international exposure. If selected, I would wait for an entry price with a much smaller (or non-existent) premium to NAV.