Tag Archives: latest-articles

Time For An Overseas Shopping Trip?

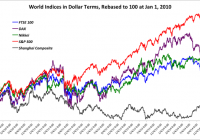
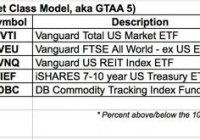
Summary US markets have performed better than any other major market in the last 5 years. Value investors are casting their gaze over international equities. However, it is important to be cognizant of the risks involved in shopping overseas. After 3 years of strong returns for the S&P 500 many value investors are casting their gaze over international markets, where gains have been more modest and valuations look more reasonable. The gain in the dollar versus other currencies has made the divergence even starker, as the chart here shows: (click to enlarge) Source: StockViews Research European markets look attractive due to cheaper valuations, while Asian markets offer some exciting growth opportunities. However, investing in international markets, particularly emerging ones, can be fraught with danger and there are a number of issues that require careful consideration. There was a time in the 1990s when investing in emerging markets was practically a sackable offence in the fund management industry. EM investing is much more in vogue now, although a healthy dose of skepticism is just as necessary. Attitude to Shareholders We often take it for granted that management will maximize value for shareholders over all else. Sometimes they focus excessively on the short-term and sometimes management gets power hungry, but the abuse of power is kept in check by strong corporate governance and pressure from shareholders. A culture of “working for shareholders” doesn’t always exist in other parts of the world. Management tends to be more entrenched, and will often prioritize their own personal ambition over the company. Shareholder activism is simply not a feature of most markets and corporate governance may be weaker. Often management will know to “make the right noises” to shareholders, but the reality does not always match up with the rhetoric. Sometimes they don’t even bother to hide their true intentions. At one meeting I had with an Eastern European bank CFO, when I asked about strategy he thumped his fist on the desk as he said “We aim to be…BIG”. Particular issues exist where a company is still part-owned by the state or is dominated by a founding family. In these cases, management may view the company with a very different perspective to shareholders – as an extension of state power or as a local employment provider. Wendelin Wiedeking, CEO of Porsche ( OTCPK:POAHY ), said in an interview: “Yes, of course we have heard of shareholder value. But that does not change the fact that we put customers first, then workers, then business partners, suppliers and dealers, and then shareholders” In some cases the longer-term focus of a family-run company can be an advantage. Most of the time, after all, the interests of multiple stakeholders are aligned. However the investor needs to get into these situations with eyes open and an understanding of management attitude – too often shareholders “cry foul” after the event, when they should have known better from the start. Disclosure of Information Equity markets are more mature in the US than other parts of the world. Over the past 100 years, disclosure has improved and adherence to US GAAP is strong. Companies often go beyond the minimum requirements and public information is freely available on the web. Elsewhere this culture is not so ingrained. There may be little disclosure beyond the statutory minimum and little effort to explain the key drivers. An industrial analyst I knew was once visiting Russia and asked the management why information was so lacking on the company, an unsatisfactory situation given his firm now owned 1% of the share base. When pressed, the CEO answered ” You have 1% of shares, I give you 1% of the information! ” State Interference For most industries in the US, it is accepted that the profits of a company belong to its shareholders. You can reasonably expect that a company will go about its business without (excessive) interference from the state. Unfortunately elsewhere many companies are subject to capricious tax regimes and even confiscation. These risks are not always obvious, since it is not a problem until it becomes one. State interference is particularly a danger where a company relies on physical assets that cannot be moved overseas (such as a mining or oil company), or when a company operates in a highly-regulated industry. In other cases (particularly in construction) a company may rely heavily on contracts from the state. Some companies, like Gazprom ( OTCQX:GZPFY ) in Russia, are so intertwined with the state it is not clear exactly what you are buying when you become a shareholder. Liquidity The US markets are the deepest and most liquid equity markets in the world. Many investors assume it is the same when they invest in foreign equities. While volumes may look strong in an up market, this can change quite rapidly into a down cycle. Combined with movements in the currency, this often leads to quite sharp declines in the stock price. Of course, the long-term investor can turn this to an advantage since a liquidity crunch can create some great buying opportunities (though patience may be required). Returns versus Growth Many investors are attracted to emerging markets by the prospect of growth. However it’s a rookie mistake to equate GDP growth with growth in the stock market. Despite 7-8% GDP growth in China over the last five years, the Shanghai Composite is the worst performing index of our five indices over five years. Some companies that are not attuned to shareholder value may chase growth regardless of returns. When a company tries to grow rapidly without addressing return on capital, this destroys value (see this StockViews Campus Video for an explanation). Investors should always be alert for these kind of situations and not be seduced by a simple promise of “higher growth”. Conclusion Of course all the risk factors listed here are generalizations. There are plenty of outstanding international companies with a deep sense of responsibility to shareholders who are pro-active about disclosure. Even where these risks do exist, you should do what you would with any investment – seek to understand the risk and factor it into what you’re prepared to pay. You will be following in the footsteps of a number of seasoned investors who have made such investments in recent years, including Buffett [POSCO (NYSE: PKX )], Peltz [Danone ( OTCQX:DANOY )] and Einhorn (Greek Banks).

Tactical Asset Allocation – January 2015 Update

And so 2014 ends. What an interesting year from the investment performance side of things. Who would have thought long-term bonds and REITs would have led the performance rankings? I’ll have much to say about the 2014 performance of the various asset classes and portfolios throughout this month but first things first. Here is the January 2015 tactical asset allocation update. Starting with the most basic portfolios, below are the January updates for the GTAA5 and the Permanent Portfolio. There were no changes from the December update. I keep a spreadsheet online that is updated automatically. There were no changes from last month. Note: the Google sheets online are having issues updating. Seems to be an issue with Google sheets. Other bloggers are having the same problems. I did the update manually for this post. (click to enlarge) (click to enlarge) Now for the more broadly diversified GTAA13 portfolio and the aggressive versions. Online spreadsheet for this and the GTAA AGG3 and GTAA AGG6 portfolios. Same issue with this online spreadsheet as I noted above. (click to enlarge) One change this month for the GTAA13 portfolio. VWO, the emerging markets ETF went on a sell signal. Assets in that ETF should be moved to cash. The AGG3 and AGG6 updates are below – no changes for this month as well. (click to enlarge) These portfolios signals are valid for the whole month of January. Now that you’ve read this, are you Bullish or Bearish on ? Bullish Bearish Sentiment on ( ) Thanks for sharing your thoughts. Why are you ? Submit & View Results Skip to results » Share this article with a colleague

I Like The Risk Level On SPLV, But I’m Not Entirely Sold

Summary I’m taking a look at SPLV as a candidate for inclusion in my ETF portfolio. I’m not huge on the expense ratio, but I like the other aspects of the ETF. The ETF is incredibly well-diversified which favorably impacts the standard deviation of returns. In the context of Modern Portfolio, the correlation and standard deviation of returns are very important. The ETF looks favorable in those regards. I’m not assessing any tax impacts. Investors should check their own situation for tax exposure. Investors should be seeking to improve their risk adjusted returns. I’m a big fan of using ETFs to achieve the risk adjusted returns relative to the portfolios that a normal investor can generate for themselves after trading costs. I’m working on building a new portfolio, and I’m going to be analyzing several of the ETFs that I am considering for my personal portfolio. One of the funds that I’m considering is the PowerShares S&P 500 Low Volatility Portfolio (NYSEARCA: SPLV ). I’ll be performing a substantial portion of my analysis along the lines of modern portfolio theory, so my goal is to find ways to minimize costs while achieving diversification to reduce my risk level. What does SPLV do? SPLV attempts to track the total return of the S&P 500® Low Volatility Index. At least 90% of funds are invested in companies that are part of the index. SPLV falls under the category of “Large Value.” Does SPLV provide diversification benefits to a portfolio? Each investor may hold a different portfolio, but I use (NYSEARCA: SPY ) as the basis for my analysis. I believe SPY, or another large cap U.S. fund with similar properties, represents the reasonable first step for many investors designing an ETF portfolio. Therefore, I start my diversification analysis by seeing how it works with SPY. I start with an ANOVA table: (click to enlarge) The correlation is about 86%. This is pretty great for making the ETF fit under modern portfolio theory. The low correlation means it should be possible to use the ETF without raising the standard deviation of returns unless the risk ETF has a very high standard of deviation of returns. Standard deviation of daily returns (dividend adjusted, measured since January 2012) The standard deviation is phenomenal. For SPLV it is .5978%. For SPY, it is 0.7300% for the same period. SPY usually beats other ETFs in this regard, so the combination of reasonable correlation and lower standard deviation than SPY is giving this ETF a real chance at being selected for my portfolio. Mixing it with SPY I also run comparisons on the standard deviation of daily returns for the portfolio assuming that the portfolio is combined with the S&P 500. For research, I assume daily rebalancing because it dramatically simplifies the math. With a 50/50 weighting in a portfolio holding only SPY and SPLV, the standard deviation of daily returns across the entire portfolio is 0.6410%. If we drop the position to 20% the standard deviation goes to .6899%. Once we drop it down to a 5% position the standard deviation is .7195%. I haven’t decided what exposure level I would use yet, but probably 5% to 10%. I really like the combination of low volatility and moderate to low correlation. If it wasn’t for the higher expense ratio, I’d consider making this a core holding. Why I use standard deviation of daily returns I don’t believe historical returns have predictive power for future returns, but I do believe historical values for standard deviations of returns relative to other ETFs have some predictive power on future risks and correlations. Yield & Taxes The distribution yield is 2.21%. The yield seems strong enough that it could be included in a retirees portfolio to bring some diversification benefits and a moderate dividend yield. I’m not a CPA or CFP, so I’m not assessing any tax impacts. If I were using SPLV, I would want it to be in a tax exempt account to remove any headaches associated with frequent rebalancing. Expense Ratio The ETF is posting .25% for an expense ratio. I want diversification, I want stability, and I don’t want to pay for them. In my opinion, a .25% expense ratio is higher than I want to pay for equity investments. It’s still low relative to many other methods of investing, but I’m looking for long term holdings and I don’t want to give my investments away. I haven’t decided if it’s worth paying the higher expense ratio to include SPLV. If the expense ratio was under .10%, this ETF would have a very strong case for being included. Market to NAV The ETF is at a .05% premium to NAV currently. In my opinion, that’s not worth worrying about. It is practically trading right on top of NAV. However, premiums or discounts to NAV can change very quickly so investors should check prior to putting in an order. Largest Holdings The portfolio is extremely well diversified. The largest position is around 1.25% of the portfolio. That is solid diversification. The intense diversification is part of the reason the volatility of the ETF is so low. Check out the chart below: (click to enlarge) Conclusion I’m currently screening a large volume of ETFs for my own portfolio. The portfolio I’m building is through Schwab, so I’m able to trade SPLV with no commissions. I have a strong preference for researching ETFs that are free to trade in my account, so most of my research will be on ETFs that fall under the “ETF OneSource” program. SPLV is a difficult ETF to make a decision on. For equity investments, the expense ratio is a bit high, but the relatively low correlation and standard deviation of returns make a pretty good argument for using at least a small position such as 5% in a long term portfolio. I could go either way on this one. I won’t consider it as a core holding (20%+) because of the higher expense ratio. Disclaimer: Information in this article represents the opinion of the analyst. All statements are represented as opinions, rather than facts, and should not be construed as advice to buy or sell a security. Ratings of “outperform” and “underperform” reflect the analyst’s estimation of a divergence between the market value for a security and the price that would be appropriate given the potential for risks and returns relative to other securities. The analyst does not know your particular objectives for returns or constraints upon investing. All investors are encouraged to do their own research before making any investment decision. Information is regularly obtained from Yahoo Finance, Google Finance, and SEC Database. If Yahoo, Google, or the SEC database contained faulty or old information it could be incorporated into my analysis. The analyst holds a diversified portfolio including mutual funds or index funds which may include a small long exposure to the stock.