Tag Archives: latest-articles

Contango Is Working Against U.S. Oil ETF Investors

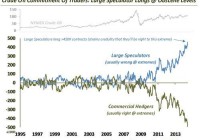
Summary WTI crude oil is in a state of contango, which will cost USO shareholders roughly 17 cents per share this month. The net long position for speculators is still too high. A V-shaped recovery in oil is unlikely. By Ivan Y. WTI and Brent crude oil prices finished 2014 down 46% and 48%, respectively. Besides a surplus in oil, which is expected to be more than 1 million bpd in 2015 for OPEC oil based on current production levels, a rising U.S. Dollar, and negative momentum, there are two other factors that are currently working against investors in The United States Oil ETF, LP (NYSEARCA: USO ). Back to Contango Just a few months ago, WTI oil was in a slight backwardization. This provided a slight benefit to USO shareholders due to the fact that the fund was paying a cheaper price when it rolled over its crude contracts every month. However, WTI oil is currently in a state of contango. Although it is not a big spread, the fund will have to pay a premium when it does its monthly rollovers. Based on Friday’s closing price, the March 2015 contract is 45 cents more expensive than the February 2015 contract. That represents a 0.85% premium and is equivalent to about 17 cents in the share price of USO. If the spread does not change this month, investors should expect USO to deteriorate in value by about 17 cents per share this month. This may not affect short-term traders, but anyone who plans to hold USO for a longer period can consider selling out-of-the-money covered call options to make up for the expected loss. For example, currently, the January (5th week) $23 call is priced at 18 cents on the bid. Selling that call should be sufficient to compensate for the expected contango loss. USO would have to rise by over 15% in order for that call to be in-the-money, so it’s likely to expire worthless. The COT Report Another issue that could put a damper on USO is the fact that speculators, according to the most recent COT report for positions as of December 23, 2014, still have a very high net long position. The so-called speculators (e.g. hedge funds) are not considered to be the smart money in the commodity markets. The report shows that they are net long by 320,337 contracts. That is significantly less than the peak of roughly 450k contracts during last June, but it is still high when compared historically. Prior to 2011, which you can see in the chart below, the net long position had not exceeded 250k contracts, and even 100k during that period was considered to be extremely high. The fact that speculators still have a very high net long position, at least when compared historically, means that there probably needs to be more liquidation before we arrive at a more normalized net long position. Thoughts on Price In hindsight, I was clearly wrong about where the price of oil would bottom. Back in October, I suggested that Brent oil would bottom around $85 (which would’ve been roughly $80 for WTI) because that was Saudi Arabia’s fiscal breakeven point. I completely underestimated the political and competitive risks to that assumption. First, at least in my opinion, one of the primary reasons for oil’s collapse was due to an orchestrated attempt by the U.S. (via Saudi Arabia’s refusal to defend the price) to punish Vladamir Putin for his extra-curricular activities in Ukraine. This is an obvious strategy that works due to the Russian government’s reliance on oil & gas sales for revenue. Second, it is also obvious that Saudi Arabia also wants to curtail the shale oil revolution in the U.S. It seems like every week, some person associated with OPEC will say something that indicates that they will not cut production and will let market forces dictate the price, even if it drops to $20 according to a Saudi oil minister. How many times do they need to keep repeating the same message? That being said, oil has already been pushed down enough to curtail cap-ex spending by many producers. Here are a few examples: Penn West (NYSE: PWE ) cuts 2015 cap-ex by $215 million ConocoPhillips (NYSE: COP ) cuts 2015 cap-ex by 20% Marathon Oil (NYSE: MRO ) cuts 2015 cap-ex by 20% However, low prices probably need to persists for several months at least in order for exploration and production to be cut in the longer-term. It really looks like Saudi Arabia is willing to suffer in the short-term in order to benefit in the long-term. Based on that, a V-shaped rebound in oil is unlikely. Saudi Arabia could, if they wanted to, move the price back up immediately just by making an announcement that they will cut production, but it doesn’t look like they want to do that. I think USO is going to struggle for several more weeks or months.

Absolute Momentum Revisited

Trend following based absolute momentum, also known as time-series momentum, is the Rodney Dangerfield of investing. It “don’t get no respect.” Absolute momentum is little known and hardly used by investors. Yet it can be a very powerful tool, leading to both enhanced return during bull markets and reduced risk during bear markets. The more common type of momentum, based on relative strength, has little or no ability to reduce bear market drawdown. It may even increase volatility and downside risk. As I show in my book, Dual Momentum Investing , using both absolute and relative momentum simultaneously is the best approach in that it lets you benefit from the return enhancing characteristics of both types of momentum while incorporating the risk reducing benefits of absolute momentum. But absolute momentum has possible uses on its own for those who simply want to limit the downside risk and enhance the expected return of single assets or fixed portfolios. That is why I wrote the paper, “Absolute Momentum: A Simple Rule-Based Strategy and Universal Trend-Following Overlay,” which is now included as Appendix B in my book. I show how absolute momentum can be applied to a number of different indexes and assets, as well as to some common portfolio configurations, such as balanced stock/bond or simple risk parity portfolios. Absolute momentum is easy to calculate and apply. It is positive if an asset’s excess return (return less the Treasury bill rate) over a specified look back period is positive. One then holds that asset until absolute momentum turns negative. In my paper, I use data going back to January 1973, since bond index began at that time and international stock index data began close to it in January 1970. Elsewhere in my book, I also use January 1973 as the start date for my analysis, since my book’s featured Global Equities Momentum (GEM) model relies on the same fixed income and international stock indexes. Those wanting to see additional momentum result history can consult the references I give in the book showing attractive profits from relative strength and absolute momentum back to 1801 and 1903, respectively. However, I now think it would be a good idea now to extend my back testing of absolute momentum, since I learned that some investors are especially attracted to absolute momentum for several reasons. First, absolute momentum trades less frequently then dual momentum, which may be important for taxable accounts. Absolute momentum applied to just the U.S. stock market gives mostly long-term capital gains from stocks. The second reason absolute momentum may be worth looking at in more depth is that some investors have only a single investment approach that they are comfortable using. They may want to hold a portfolio that focuses solely on value plus profitability (see my earlier post, ” Value Investing Redux “), quality, hedge fund cloning, stock buy backs, dividend appreciation, micro caps, or other factors. So I think it would be helpful to see how absolute momentum looks when applied to aggregate U.S. stocks using the long-term Kenneth French data library that is available online. I compare 10 and 12 month absolute momentum filters to commonly-used 10 and 12 month simple moving average filters from April 1927 through December 2014, a period of 87 years. When we are out of stocks, assets are invested in one month Treasury bills. Here are the results with monthly readjusting of positions without transaction costs: Abs12 MA12 Abs10 MA10 US Mkt ANN RETURN 11.06 9.76 11.45 9.77 11.74 ANN STD DEV 12.53 12.83 12.88 12.50 18.70 ANN SHARPE 0.57 0.46 0.58 0.48 0.41 MAX DD -43.98 -48.22 -41.44 -56.62 -83.70 These are hypothetical results and are not an indicator of future results and do not represent returns that any investor actually attained. Please see our Disclaimer page for additional disclosures. (click to enlarge) We see that absolute momentum gives very attractive results compared to both buy and hold and the use of moving averages. Absolute momentum shows higher returns and Sharpe ratios, as well as lower maximum drawdowns, than comparable moving averages. In addition, moving averages have approximately 50% more trades and more false whipsaw signals than absolute momentum. So if we were to account for transaction costs, absolute momentum signals would look even more attractive compared to their moving average counterparts. Because of the additional transactions, moving averages are also not as tax efficient as absolute momentum. Dual momentum is still the premier momentum strategy for most investors, but absolute momentum may be a valuable tool for many others.

Recap: The Best And The Worst In Alternative Investment ETFs

John Bogle, founder of the Vanguard fund family, has cautioned investors for many years about playing cute with their investment portfolios. “Don’t look for a needle in the haystack,” says Saint Jack, “just buy the haystack.” With that, Bogle inveighs against stock-picking and advocates the use of index funds. Why try to beat the market, in his view, since you can’t do it consistently? Not surprisingly, many investment advisors rail against Bogle’s notion. Some, particularly those running endowments and foundations, are duty bound to seek equity-like returns without the concentrated risk of stock investments. Which brings us to alternative investments. Mixing “alts” into a portfolio can, in the best of circumstances, enhance returns and diversify risk. This year, though, alts have had an especially tough row to hoe. Domestic equities, measured by the performance of S&P 500 SPDR ETF (NYSEARCA: SPY ) , gained 15 percent in 2014 with an annualized volatility of 11 percent. As stand-alone investments, only one alt category outperformed the domestic stock market. (click to enlarge) Alts, of course, aren’t meant to be stand-alones; they’re destined, for most investors, to be portfolio adjuncts. Real estate was the standout of the year, offering a one-two combination punch of outsized gain and low volatility. The PowerShares Active US Real Estate ETF (NYSEARCA: PSR ) more than doubled SPY’s return with a smaller standard deviation. All this with a middling correlation to the broad equity market. If you were shopping for negative correlation to equities this year, the shelves were rather bare. Only two ETFs – the SPDR Gold Shares Trust (NYSEARCA: GLD ) and the QuantShares US Market Neutral Value ETF (NYSEARCA: CHEP ) – cranked out negative coefficients against SPY. And the price for this? Negative returns, though arguably you could say GLD had a breakeven year. If you base your diversification success on the Sharpe ratio – a gauge of risk-adjusted returns – this year’s runner-up alt bets were managed futures and absolute value, epitomized by the WisdomTree Managed Futures Strategy ETF (NYSEARCA: WDTI ) and the HedgeIQ Real Return ETF , respectively. The derby for 2015’s best and worst kicks off today. Stay tuned for ongoing updates.