Tag Archives: latest-articles

Maybe You Should Be In 100% Cash

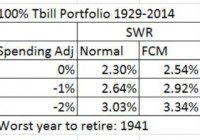
This post has nothing to do with asset prices, valuation, or timing the market as the title may have led you to believe. It has to do with investor psychology and behavior. Over the years I’ve wondered if certain types of people would be happier if they didn’t invest in anything but cash. Not ‘better off’ mind you just happier and still able to meet their financial goals – like a successful happy retirement. Then I said, “I have the data for that analysis.” Let’s take a look at the kind of people I’m talking about. You’ll probably see a bit of yourself in my description. Then let’s see what kind of retirement such a person could reasonably expect and some strategies to make it better. I think we all know the type of person I’m alluding to. Most investors have some of these traits. Constantly worried about any kind of investment. Stocks – they’re always too expensive or so cheap it’s an indication of some forthcoming dire event and thus they must continue to go down. International stocks – same thing, even worse. Bonds – even the mighty U.S. government is going default for sure. Any day now. Gold – sure, we gotta have a lot of that but I need to check the prices three times a day. And anytime prices go down it’s manipulation. Inflation – we’re constantly falling behind in standard of living. At the extreme, always worried about large inflation any day now. Yield – the need to reach for yield and check news every day that may affect the income stream. Price fluctuations of any significant amount are a sign to take action and seek refuge. Logging in to investment accounts way more than necessary and checking account balances. Glued to financial news of any kind. Tweaking investments all the time always looking for the better bet. In general, constant unease about the future and definitely not able to sleep comfortably at night. I may be exaggerating a bit but I know quite a few people, young and old, that would fit a large part of this description. And I think a large part of these people can overcome these behavioral obstacles, especially by adapting an automatic investment process or system like the ones I discuss on this blog. But I also often wonder if some people would be better off just sticking with investing in 100% cash and never taking any investment risk. They would be much happier. Let’s take that as a given and see how much could such a person expect to reasonably withdraw from their cash portfolio in retirement (which also determined what size portfolio such a person would need to retire). Let’s find out. Using the database I use to calculate SWRs (see here for an example), I replaced the U.S. 10 year bond returns with the historical series for the U.S. 3 month T Bill from 1929 to 2014 to represent cash returns. This is a pessimistic return series to use for cash returns but it’s the best series with that much history. Normally, even in environments with very low U.S. T Bill rates an investor can get cash returns out to 1 year that are quite a bit higher. For example, even with today’s low T Bill rates of 0.14% or so you can get a 1 year CD at many banks yielding over 1%. Below are the historical SWRs (Safe Withdrawal Rates) for a few scenarios with a 100% cash portfolio. The historical SWR for a 100% cash portfolio is 2.3% using a normal inflation adjusted spending model. That is quite a lot lower than the 4% from a 60/40 U.S. stock bond portfolio but definitely do-able. And definitely a portfolio that would have allowed for many more restful nights. The rest of the table shows what the SWR would be with some tweaks to the spending model. The FCM (floor-ceiling) model adjusts inflation adjusted spending down during bad return years. The spending adjustment column uses the historical fact that retirees’ spending increases less than inflation, between 1-2% less than inflation in fact. Using these better spending models increases the historical SWR to 3.34%. Doesn’t sound too bad now does it? Not too far off from the old 4% rule. But how realistic are these spending scenarios? In my opinion and in my experience the above spending scenarios are easily achievable. Think about what people did before easily accessible and low cost investment options. Investing was something reserved for the wealthy or least very well to do. It’s only in modern times that investing is so widespread and accessible. How did your parents or grandparents plan and survive retirement? If they were like my grandparents they planned and survived retirement through a combination of saving a lot and not spending a lot. There was never any investment talk. Getting them to trust bank CDs took almost 10 years! Yet they made it and were quite happy along the way. Sure, they could have been ‘better off’ but they wouldn’t have been as happy. Now lets turn to a modern and more tangible example, me and my wife Nina. From our base spending level in 2005, we spent 53% less in 2014. Yes, that involved a massive life change. By choice. You can read out it on Nina’s blog and even watch a little video about it. But it was for the better. Infinitely better for us. Oh, and that is in nominal terms. In real dollars, we spend 70% less (inflation has grown 2005 dollars by 20%) than we did in 2005. OK, that’s cheating a bit. At least in the ability to generalize from a very specific and personal choice. So, lets take our spending change since we started RV’ing in 2010. In 2014 we spent 10% less than we did in 2010. Inflation is up 8% since then. In real dollars that means we spend 18% less than we did in 2010. That’s over 3% a year. Obviously that can’t go on forever. And we’re pretty much at the bottom of the curve so to speak. Any further dramatic changes would require a reduction in quality of life which is not acceptable to us. Going forward our goal is to keep spending flat in nominal terms. Worst case to keep pace with inflation. I think that is pretty achievable. Our example just goes to show that controlling your spending so that it grows less than inflation is certainly achievable and not just data from some impersonal random study. The other aspect of future spending is that most people have some type of retirement or pension income that begins in later years. This is mainly social security. So, in order to get a truly realistic picture of the future we need to forecast cashflows on a yearly basis. Then we can get a true picture of what SWRs would look like from a 100% cash portfolio. Kind of like I talked about in this post . Let’s consider a 65 year old couple just beginning retirement, delaying social security until 70, a median social security income of that covers about 40% of their expenses, and controlling their spending so that it grows at 1% less than inflation. Taking this cash flow model and applying it to the historical returns from a 100% cash portfolio gives us a worst case SWR of 4.13% for the 30 year retirement period starting in 1942. Not so harsh a retirement after all. Even in 100% cash. And definitely many more restful nights than an equity heavy portfolio. In conclusion, sometimes taking an extreme position can be quite thought provoking and insightful. Admittedly, that is what I’ve done here. It was also a bit tongue in cheek. I’ve shown that even with a 100% cash portfolio a reasonable retirement can be had by focusing on the other side of the equation, spending, and using some more realistic retirement assumptions. People have been doing it for a long time. A lot longer than they have been investing in broadly diversified portfolios across world wide asset classes and markets. And maybe this thought experiment allows us to worry a bit less about our investments and have some more restful nights for just having thought through these alternative scenarios.
Is 2015 The Year For Municipal Bond ETFs?

The U.S. muni bonds market had a great 2014 with its returns just below the S&P 500 and the Dow Jones Industrial Average. These two blue chip indices advanced a respective 15.3% and 11.5%. With the S&P 500 also crossing the 2,000 mark, muni bonds turned out to be the third best performing category gaining 8.7% (per Wall Street ), its three -year best. Needless to say, the $3.6 trillion muni bond market breezed past the 6.97% return generated by investment grade corporate bonds and 4.6% return delivered by the safe-haven U.S. treasuries. In fact, this outperforming corner of the bond market has not fallen behind even in a single month of 2014. This was in stark contrast to a lackluster performance in 2013 when the space crumbled thanks to poor financial health of Detroit and Puerto Rico as well as rising rate woes. Behind the Surge Municipal bonds are an excellent choice for investors seeking a steady stream of tax free income. Usually the interest income from munis is exempt from federal tax and may also not be taxable per state laws, making it especially attractive for investors in the high tax bracket looking to reduce their tax liability. Apart from investors’ desire for a tax-shelter, the demand-supply imbalance, improving fiscal health of many municipal bond issuers and a defensive sentiment prevailing in the market on sluggish global recovery made for a rewarding combination. As per Janney Montgomery , U.S. municipal-bond issuance will decline each year through 2017 to as low as $175 billion. Investor’s appetite for munis pushed the yields to multi-month lows. If this was not enough, the space is presently undervalued. A recent Bloomberg article stated that muni bonds almost reached the ‘cheapest’ valuation as compared to U.S. treasuries in 2014. The flight to safety mode led investors to grasp Treasuries quickly making munis an undervalued investment proposition. A Bet for 2015 Too With the deadline for income tax return filing coming closer, demand for municipal bonds should be on a roll in the New Year as well. Investors should note that munis are safer bets compared to corporate bonds and yield better than treasuries. With the Fed insisting to take a ‘patient’ stance on the rate hike issue, the higher yield nature of the munis should keep it in a straight up trajectory. ETF Plays Thanks to the muni boom, as much as $13.4 billion of assets were in muni ETFs’ as of September 30, an all-time high. Given the bright prospects of the muni space, let’s look at some of the top performing ETFs in the space. These could be a good way to target the best of the segment and these might be interesting selections for 2015 as well: Market Vectors CEF Municipal Income ETF ( XMPT ) This overlooked choice looks to track the S-Network Municipal Bond Closed-End Fund Index. The product is composed of shares of municipal closed-end funds listed in the U.S. that are principally engaged in asset management processes designed to produce a federally tax-exempted annual yield. Notably, closed-end products are best-suited for those who seek higher income. The product charges165 bps in fees and has mustered an asset base of $39 million. The fund is up 17.8% year to date and 0.6% in the last one month (as of December 31, 2014). The fund has a dividend yield of 5.58% as of the same date. SPDR Nuveen Barclays Build America Bond ETF ( BABS ) This is a long-term muni bond ETF and thus scored the best in 2014 thanks to the flattening of the yield curve. The product looks to track the Barclays Build America Bond Index, which is a division of the Barclays Taxable Municipal Bond Index. The product has amassed about $113.2 million in assets and charges about 35 bps in fees. The fund is up 21.3% this year and 2.23% in the last one month (as of December 31, 2014). The fund has a dividend yield of 3.61%. Market Vectors Long Municipal Index ETF ( MLN ) This fund looks to track the Barclays Capital AMT-Free Long Continuous Municipal Index. This Index intends to mainly measure the performance of long-duration U.S. muni bonds with nominal maturity of at least 17 years. Income from MLN is free of the federal tax burden and alternative minimum tax. The ETF has managed an asset base of about $93.5 million and has an expense ratio of 0.24%. MLN is up 17% so far this year and up 1.82% in the last one month. The fund has a dividend yield of 3.86%.

Any Hope For A Gold And Oil ETF Rebound In 2015?

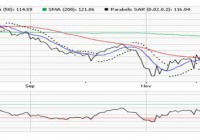
Gold and oil were the two most-talked-about commodities last year thanks to their awful performances. These two widely-followed commodities witnessed dire trading in 2014 with the latter being thrashed heavily by the strength of the greenback, demand-supply imbalances, and cooling geo-political tension in the second half of the year. While muted global inflation, reduced demand from key consuming nations like China and India restricted the yellow metal’s northward ride, the return of worries in the Euro zone, and poor data points from Japan and China have made oil more diluted. As a result, oil prices plummeted more than 50% in 2014 and gold registered the first consecutive annual decline last year since 2000 . Some are also worried that the slump could continue as the Fed is now on its way to hike the key rate this year. The Fed’s step strengthened the dollar and in turn marred commodity investing. Great Start to New Year for Gold Having lost more than 8% in the last six months, SPDR Gold Trust ETF (NYSEARCA: GLD ) bounced back to start the New Year gaining about 2% in the last two trading sessions as of (January 5, 2014). So, did the biggest gold mining fund, Market Vectors Gold Miners ETF (NYSEARCA: GDX ) , which has added about 5.8% during the same phase. Gold miners – which often trade as leveraged plays on gold – delivered two successive years of negative performances losing about 50% in 2013 and 16% in 2014. A sagging stock market and worries over Greece political crisis indicating the nation’s likely way out of the Euro area bolstered the safe-haven appeal of gold to start this year. As a result, gold bullion crossed the $1,200/ounce mark after a few months. In such a situation, investors might want to know the upcoming course of gold related ETFs. We do not expect the latest uptrend to last long. Most of the macroeconomic indicators that went against gold prices last year like the Fed policy, strong U.S. dollar and deflationary spell, will nothing but intensify this year. GLD is trading a little below its 200-day simple moving average but higher than 50 and 9-day simple moving averages which signify long-term bearishness for the ETF. The biggest fund in the space, GLD, is yet to enter the oversold territory as depicted from the above chart. The ETF is trading at a Relative Strength Index (RSI) value of 53.48 indicating there is room for further erosion in the price once the risk-off sentiments drop out of sight. The trend was similar for GDX too with current price trading below long-term averages and above the short-and-medium term averages. Its RSI value stands at 56.54. In a nutshell, miners will likely follow the underlying metal’s direction, obviously with higher magnitude, this year. Overall, the gold mining space will likely see a mixed 2015 and will be busy paring down losses incurred last year. Investors interested to bet on gold should follow the space closely as it is expected to be on a roller coaster ride this year. No New Year Party for Oil Unlike gold, there was no celebration for oil this New Year. WTI crude prices are now below $50, marking a massive slide from their level a year ago. Needless to say, this was a new multi-year low. Persistent supply glut, no production cut by OPEC as well as the U.S. will keep the space under pressure. United States Oil Fund ( USO ) is trading a little below long, medium and short-term moving averages which signifies utter bearishness for the product. In fact, it seems as though oil does not have any driver which can revive it in the near term. However, the product is presently trading at a RSI value of 22.53 indicating that it slipped into oversold territory and might change its course soon after hitting a bottom. Per barrons.com , Citigroup’s commodity group cautioned about a frustrating 2015 for oil and slashed its oil-price forecast for this year and the next to even lower than its most bearish prior estimates. Citi cuts price expectation for WTI crude from $72/barrel to $55 in 2015 while Brent oil price expectation has been reduced to $63 a barrel from $80 a barrel. Bottom Line In short, 2015 should not be great for both commodities and the related ETFs barring some occasional spikes which can be defined as a correction. Investors dying to look for a sustained trend reversal in these commodities, should wait for a big Chinese and Euro zone stimulus, which may bolster the regions’ waning manufacturing industry spurring the usage of oil and goading investors to buy more gold (notably, China is the world’s largest consumer of the yellow metal). Investors should also look out for a pull back in oil production and the return of geo-political tensions. As far as the Fed rate hike is concerned, we believe that the most of it has been priced in at the current level, suggesting that either way, it will be another interesting year for oil and gold.