Tag Archives: joel-greenblatt

Value Or Momentum? Try Both

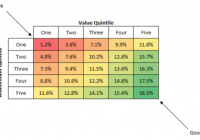
Let’s go back in time 30 years. Remember those “Taste great/less filling” Miller Lite beer commercials from the mid-1980s? You could roughly divide the world’s beer-drinking population into two rival factions: Those that insisted that Miller Lite tasted great… and those that insisted it was less filling. I believe many men lost their lives fighting over this in bars. And I suppose as far as causes go, it’s as good of a cause as any to die for. I consider Miller Lite to neither taste particularly great nor be particularly easy on my stomach. As a native Texan, my heart will always belong to Shiner Bock. But I digress. We’re not here today to discuss beer dogmatism but the far more practical world of investing. As with Miller Lite fans, you can roughly divide the investing world into two camps: Those who favor value strategies and those that favor momentum strategies. Both camps will insist that the academic research – and real world experience – prove that “their way” beats the market over time. And both camps are absolutely right. Simple value screens like Joel Greenblatt ‘s ” Magic Formula ” have beaten the market by a wide margin, and research has shown that a strategy of screening stocks based on simple momentum criteria also beats the market over time. So if value works… and momentum works… what would it look like if we combined the two? Pretty good, actually. Quant guru Patrick O’Shaughnessy wrote an excellent piece last year in which he parses the universe of stocks into value and momentum buckets. Take a look at the following table, taken from O’Shaughnessy’s article. (click to enlarge) The bottom row of the table represents the top 20% of all stocks by momentum. The returns get gradually better as you move down the value scale. In other words, momentum stocks that are cheap outperform momentum stocks that are expensive. And it’s not by a small margin. The cheapest high-momentum stocks returned 18.5% per year, whereas the most expensive high-momentum stocks returned 11.6%. And viewing it through a value lens tells the same story. The right-most column represents the cheapest stocks in the sample using a composite of value metrics. All value-stock buckets performed well. But as you move down the column, the returns get a lot better. In other words, cheap stocks that have recently shown momentum perform better than cheap stocks that don’t. This is a fancier way of repeating the old trader’s maxim to never try and catch a falling knife. Cheap stocks can always get cheaper. What should we take away from this? Value investing works. Momentum investing works. And combining value and momentum works best of all. This article first appeared on Sizemore Insights as Value or Momentum? Try Both. Disclaimer: This site is for informational purposes only and should not be considered specific investment advice or as a solicitation to buy or sell any securities. Sizemore Capital personnel and clients will often have an interest in the securities mentioned. There is risk in any investment in traded securities, and all Sizemore Capital investment strategies have the possibility of loss. Past performance is no guarantee of future results. Original Post
Book Review: Quantitative Value

Wesley Gray, manager of the ValueShares US Quantitative Value ETF (BATS: QVAL ), may very well be the most interesting quant you’ll ever meet. Granted, the word “quant” brings to mind an old man in a white lab coat stooped over reams of data, but hear me out. Before getting his PhD in finance from the University of Chicago, Gray did four years of service as an active-duty U.S. Marine Corps ground intelligence officer in Iraq and other posts throughout Asia. Quantitative Value isn’t even his first book. That distinction goes to Embedded: A Marine Corps Adviser Inside the Iraqi Army . It’s hard to imagine the average fund manager crawling through the muck and gathering intelligence in Iraqi Arabic. But that is Dr. Gray, and his work is far from average. Quantitative Value , co-written by Gray and Tobias Carlisle, is a solid piece of research that combines the successful value investing framework of Benjamin Graham and Warren Buffett with the analytical rigor seen in Jim O’Shaughnessy’s What Works on Wall Street and Joel Greenblatt ‘s The Little Book that Beats the Market . In fact, Gray and Carlisle write extensively about Greenblatt’s “Magic Formula” and much of the book is an attempt to build the proverbial better mousetrap. We’ll take a look at some of Gray and Carlisle’s methods and then see how they perform in the real world by tracking the returns of the Quantitative Value ETF. The Quantitative Value screening process for stocks resembles a funnel: Step 1: Avoid Stocks That Can Cause a Permanent Loss of Capital This is a more elegant version of Warren Buffett’s first rule of investing: Don’t lose money. In first screening for risky stocks, Gray and Carlisle use some of the same metrics used by short seller John Del Vecchio to identify short candidates, such as days sales outstanding. They also give special attention to accrual accounting in the hopes of weeding out earnings manipulators and run additional screens for probability of financial distress. By removing the riskiest stocks from the pool at the beginning, Gray and Carlisle are a lot less likely to get sucked into a value trap. Step 2: Find the Cheapest Stocks Gray and Carlisle do extensive back testing on virtually every valuation metric under the sun, including industry standards such as price/earnings (“P/E”), price/sales (“P/S”) and price/book value (“P/B”). In the end, they opt to use the same valuation metric as Greenblatt in his Magic Formula: the Earnings Yield, defined here as earnings before interest and taxes (“EBIT”) divided by enterprise value. For those unfamiliar with the term, “enterprise value” is defined here as market cap (including preferred stock) + value of net debt, or what you might think of as the acquisition price of the company. Gray and Carlisle find that of all the assorted valuation metrics, the Earnings Yield yields the best results. Step 3: Find Highest-Quality Stocks This is another nod to both Buffett and Greenblatt. Buffett has repeated often that it is better to buy a wonderful business at a fair price than a fair business at a wonderful price, and Greenblatt tried to capture this mathematically by screening for companies that generated high returns on capital (“ROC”). Gray and Carlisle take it a step further by using an 8-year ROC figure. And they don’t stop there. Gray and Carlisle run additional screens for profitability and combine the metrics into a Franchise Power score. And taking it yet another step, they combine Franchise Power with Financial Strength to form a composite Quality score. Again, the objective here is to capture mathematically what makes intuitive sense: That companies with wide competitive moats, strong brands and strong balance sheets make superior long-term investments. So, how does the Quantitative Value model actually perform? In back-tested returns, it crushed the market. From 1974 to 2011, Quantitative Value generated compounded annual returns of 17.68% to the S&P 500’s 10.46%. Of course, we should always take back-tested returns with a large grain of salt. For a better comparison, let’s see how the Quantitative Value ETF has performed in the wild. We don’t have a lot of data to work with, as QVAL only started trading in late October 2014. But over its short life, QVAL is modestly beating the S&P 500’s price returns, 9.96% vs. 9.15%. As recently as April, it was beating the S&P 500 by a cumulative 4%. Looking at the returns of a substantially-similar managed account program managed by Gray’s firm, the “real world” results look solid. From November 2012 to May 2015, the Quantitative Value strategy generated compounded annual returns of 21.1% vs. the 18.3% return of the S&P 500. The Quantitative Value strategy was modestly more volatile (beta of 1.2) and had slightly larger maximum drawdowns (-6.0% vs. -4.4%). But this is exactly what you would expect from a concentrated portfolio. I look forward to seeing how QVAL performs over time, and I congratulate Gray and Carlisle on a book well written. Note: When referring to the book, “Quantitative Value” is italicized. When referring to the ETF or to the broader strategy, it is not. Original post Disclaimer: This article is for informational purposes only and should not be considered specific investment advice or as a solicitation to buy or sell any securities. Sizemore Capital personnel and clients will often have an interest in the securities mentioned. There is risk in any investment in traded securities, and all Sizemore Capital investment strategies have the possibility of loss. Past performance is no guarantee of future results.