Tag Archives: iyr

Commercial Real Estate May Help Provide A Smoother Ride On The Road To Your Investment Goals

By Jennifer Perkins, Portfolio Manager, Principal Real Estate Investors Much hasn’t changed since the start of the year! Financial markets have recovered somewhat, but are still volatile due to geopolitical concerns, and declining oil and commodity prices have also impacted stock prices and economic growth. Meanwhile, the chase for yield in a low interest environment still continues in fixed-income markets. With an eye on the road ahead, investors are hoping for a smoother and less stressful ride to meet their investment goals. The vehicle that could get them there is commercial real estate! This is the second in a series of four blog posts highlighting some compelling reasons why we believe many investors should include private – also referred to as direct-owned – commercial real estate in their investment portfolios. While these reasons are not new, market volatility, changing market dynamics, and the potential of lower long-term return expectations raise an opportunity to reiterate the case for considering the asset class for inclusion into your portfolio. Compelling reasons to include private commercial real estate: Adds portfolio diversification. May aid in dampening volatility, potentially increasing portfolio total risk-adjusted return. A source of potential income. A possible defense against unexpected inflation. Just to recap, my last blog post discussed why private commercial real estate hasn’t historically conformed to similar whipsaw behavior the equity market was experiencing at the start of 2016, potentially allowing for private commercial real estate to add true diversification to an investment portfolio. This blog post expands upon Reason 2: Private commercial real estate may aid in dampening volatility and increases the potential for improving total portfolio returns adjusted for risk. As an investor in private commercial real estate, you are buying units of ownership of office buildings, industrial buildings, apartment buildings, retail centers, and even hotels. The buildings comprising a larger portfolio are acquired through private transactions between a willing buyer and seller, specific to individual properties. Investing in tangible properties influenced by space market fundamentals (meaning tenant demand and available supply) versus investor sentiment likely helps to dampen volatility. Unlike Real Estate Investment Trusts (REITs), private commercial real estate is not influenced by fractional ownership trading, which occurs in public markets on a public exchange. Values of private commercial real estate are also supported by in-place contractual leases, typically having meaningful duration, that help drive a steady and fairly predictable stream of income for investors of core, occupied commercial real estate. Investor return requirements on this current income, as well as total holding period returns, are driven by spreads over risk-free rates (Treasurys). Such tenant demand, available supply, contractual lease terms, and investor return requirements don’t dramatically change each and every day, thereby helping to create the potential for a return pattern with lower volatility or variability over an investment period. Over the past 10 years, the ride or return pattern experienced when investing in stocks, bonds, and private commercial real estate has been notably different (see Exhibit A). The return pattern for commercial real estate has been far smoother compared to stocks and bonds. By including an allocation to commercial real estate in an investment portfolio, the ride over the investment period could be smoother, with less turbulence. Click to enlarge Indexed to 100 as of 31st March, 2016; Source: 500 Data (Bloomberg), Investment Grade Corps (Barclays), CRE Private Equity (NFI-ODCE EW); It is not possible to invest directly in an index. Past performance does not guarantee future results. A smoother expected ride also creates the potential for increased total portfolio returns when adjusted for risk. Private commercial real estate could offer a strong income (current) return (historically 70-80% of total return) as well as the potential for appreciation (or depreciation). Exhibit B shows the effects of increased exposure to private commercial real estate has produced a slight increase to total portfolio returns, but most notably, lowered the risk, or volatility, of those returns over the 10-year time period. Therefore, the inclusion of private commercial real estate within an investment portfolio has the potential to increase total portfolio return per unit of risk. Click to enlarge Click to enlarge Click to enlarge Source: S&P 500 Data (Bloomberg), Investment Grade Corps (Barclays), CRE Private Equity (NFI-ODCE EW) In my next blog post, I will discuss Reason 3: Private Commercial Real Estate is a potential source of durable income ; another compelling reason to consider including commercial real estate as part of an investment portfolio. Stay tuned and enjoy the ride! — 1 Percentage of risk shown is the annualized standard deviation of index returns and is a measure of return volatility. 2 Annualized holding period total returns divided by standard deviation of returns over equivalent period. It is not possible to invest directly in an index. Past index performance is not indicative of future return.
Asset Class Scoreboard – Eli Manning Edition

Coming into the month of October, the Asset Class Scoreboard was looking brutal , with six of the eight asset classes we track in the red on the year. We mentioned it was time for the star of the portfolio to show up the last three months of the year, and it seems like they heard us… Seven of the eight asset classes in October recorded positive numbers in October, with Managed Futures the only asset class in the negative, down -0.86% on the month. Stocks, World Stocks, and Real Estate all recorded 6%+ returns for the month on the heels off the Fed deciding not to raise rates in 2015 (although now there’s talk of December being back in play). But we can’t help but wonder if October’s great numbers are a little bit like the Manning brothers in action on Monday, where Eli Manning was the first QB in NFL history to throw six touchdowns, no interceptions, and still lose the game . Are these October returns just a few touchdown passes on the way to a losing game (the year) or are they the start of a comeback? It feels like the back and forth of that Giants/Saints game, where Eli had to score 6 touchdowns, because the other guy had 5 already. On the investment side, you have to have big returns just to make up for those poor ones a few months ago. This is what volatility looks like in real life – scoring a touchdown/giving up a touchdown, winning/losing, winning again, losing again. October was just the start of the fourth quarter… we’ll see who has the ball last in this game and wins the year. (click to enlarge) (Disclaimer: Past performance is not necessarily indicative of future results.) Source: All ETF performance data from Morningstar.com . Sources: Managed Futures = Newedge CTA Index, Cash = 13 week T-Bill rate, Bonds = Vanguard Total Bond Market ETF (NYSEARCA: BND ), Hedge Funds = IQ Hedge Multi-Strategy (NYSEARCA: QAI ) Commodities = iShares GSCI ETF (NYSEARCA: GSG ), Real Estate = iShares DJ Real Estate ETF (NYSEARCA: IYR ), World Stocks = iShares MSCI ACWI ex US Index Fund ETF (NASDAQ: ACWX ), US Stocks = SPDR S&P 500 ETF (NYSEARCA: SPY ).

Which U.S. REIT ETF Has The Best Dividend Growth?

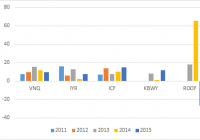
Summary REIT ETFs have attracted investor interest in the prevailing low interest rate environment. This article studies the dividend growth history of four U.S. REIT ETFs. Data are analyzed to identify the REIT ETF with the highest yield, the highest dividend growth rate and the highest “Chowder number”. Introduction The current low-interest rate environment has stimulated interest in income-generating securities such as real estate investment trusts [REITs]. Investors uncomfortable with picking individual stocks may prefer to invest in REIT ETFs. The Vanguard REIT Index Fund (NYSEARCA: VNQ ) is the largest REIT ETF, with over $25B in assets. Besides providing a relatively high yield, REITs can also grow their distributions. This article seeks to compare the dividend growth history of five U.S. REIT ETFs to determine which fund has the best dividend growth characteristics. The funds The funds chosen were VNQ, the iShares U.S. Real Estate ETF (NYSEARCA: IYR ), the iShares Cohen & Steers REIT ETF (NYSEARCA: ICF ), the KBW Premium Yield Equity REIT Portfolio (NYSEARCA: KBWY ) and the IQ US Real Estate Small Cap ETF (NYSEARCA: ROOF ). VNQ, IYR and ICF were chosen as these were the three largest REIT ETFs by assets under management [AUM]. KBWY and ROOF were chosen as these represented small/mid-cap REIT ETFs. Note that ROOF also contains some exposure to mortgage REITs [mREITs] such as New Residential Investment Corp (NYSE: NRZ ), which is currently its top holding. Details for the five REIT ETFs are shown in the table below (data from Morningstar ).   VNQ IYR ICF KBWY ROOF Yield [ttm] 3.86% 3.69% 3.20% 5.21% 5.18% Expense ratio 0.12% 0.45% 0.35% 0.35% 0.69% Inception Sep 2004 Jun 2000 Jan 2001 Dec 2010 June 2011 Assets $25.9B $4.43B $3.20B $113M $92.6M Avg Vol. 4.0M 10.2M 333K 23.7K 22.3K No. holdings 144 115 30 30 68 Avg. Cap $8.8B $11.6B $17.6B $1.8B $1.5B Annual turnover 8% 21% 8% 27% 17% Morningstar rating *** *** ** ***** ***** As can be seen from the chart above, VNQ, IYR and ICF are very large REIT funds, with billions of dollars in AUM. By comparison, KBWY and ROOF are much smaller, with around $100 million in assets. Additionally, the average market capitalization of VNQ, IYR and ICF range from $8.8B to $17.6B, while KBWY and ROOF, being mid/small-cap REIT ETFs, have much smaller average market capitalizations of $1.8B and $1.5B, respectively. In terms of expense ratio, VNQ is the cheapest at 0.12% while ROOF is the most expensive at 0.69%. Finally, KBWY has the highest yield of 5.21%, while ICF has the lowest yield of 3.20%. Dividend grow th history Only three of the funds in this study, VNQ, IYR and ICF, existed before the financial crisis in 2008-2009. Moreover, all three funds cut their distributions in the recession. Therefore, only the last six years of dividend history will be considered. Year-on-year dividend growth The following chart shows the year-on-year dividend growth for the five funds since 2011. Since only the first two quarters of dividends of 2015 have been declared thus far, the dividend growth % shown for “2015” actually represents the growth of the dividend from the previous 8th to 5th quarters (i.e. 2013 H2 + 2014 H1) to the last 4 quarters (i.e. 2014 H2 + 2015 H1). The same calculation applies to the other years in the chart. The chart above shows that the distribution history for ROOF is extremely lumpy, with a 65% increase in distribution for 2014, followed by a -27% decrease in distribution for 2015. Hence, ROOF was removed from subsequent analysis so that the differences between the other four funds can be more clearly observed. The following chart is the same as the previous one, but with ROOF removed. The chart above shows that all of the ETFs have had quite robust dividend growth over the past 5 years. 3 or 5-year average dividend growth For further comparison, I have computed the average year-on-year dividend growth percentages for each of the funds over either the past 3 or 5 years. We can see from the chart above that VNQ has had the highest dividend growth over both 3-year and 5-year periods, with average year-on-year dividend growth rates of 12.2% and 10.7%, respectively. KBWY had the lowest average 3-year dividend increase of 7.04%. Another way to compare dividend growth rates is the cumulative increase in dividend. The following chart shows the cumulative 3-year and 5-year annualized dividend growth rates of the four funds. Presenting the data in this way shows a similar story. VNQ still has the highest annualized cumulative 3-year and 5-year dividend growth rates of 12.2% and 10.7%, respectively. Chowder numbers The ” Chowder number ” is determined by adding the current yield of a security to the historical dividend growth rate. The Chowder number can be considered as a proxy for the expected total return of a security, assuming that the dividend yield of the asset stays the same. The following chart shows the Chowder numbers of the four funds using the annualized 3-year DGR. We can see from the chart above that VNQ has the highest Chowder number of 16.0%, while IYR has the lowest Chowder number of 11.20%. This suggests that going forward, VNQ might be the best investment from the total return perspective. However, one caveat is that, Chowder numbers are backward-looking and one could question whether or not dividend growth rates of REIT ETFs can be reliably extrapolated into the future. Performance The following chart shows the total return performances for VNQ, IYR and ICF over the past 5 years. The data shows that all three REIT ETFs move closely together, with VNQ leading the pack at 83.6% (12.9% annualized). The following chart shows the total return profiles for the four REIT ETFs over the past 3 years. We see that KBWY has had the best 3-year total return of 40.3% (11.9% annualized), followed by VNQ at 32.7% (9.9% annualized). IYR had the worst performance over both 3-year and 5-year periods. Conclusion This article explored the dividend growth history of three large-cap U.S. REIT ETFs, namely VNQ, IYR and ICF, as well as the mid/small-cap REIT ETF KBWY. However, the “best” REIT ETF may depend on each investor’s personal preference. Looking for the highest dividend growth rate? VNQ had the highest annualized 3-year and 5-year dividend growth rates of 12.1% and 10.7%, respectively. Looking for the highest current yield? KBWY has the highest current yield of 5.21%. Looking for the highest “Chowder number”? Using 3-year dividend growth rates, VNQ has the highest “Chowder number” of 16.0% (3.9% yield + 12.1% DGR). Looking for the best past performance? KBWY had the best total return performance (40.3%) over the past 3 years out of the four REIT ETFs, while VNQ had the best total return performance (83.6%) over the past 5 years out of VNQ, IYR and ICF. Interestingly, the “winner” of each of these categories was either VNQ or KBWY. Another reason to pick VNQ is its cheap expense ratio of 0.12%, which is the lowest out of the four funds. VNQ’s combination of 3.9% yield and 12.1% 3-year dividend growth rate makes this fund my top pick for a U.S. large-cap REIT ETF. On the other hand, KBWY provides exposure to the mid/small-cap segment of U.S. REITs, which offers diversification benefits as well as the potential for higher returns (accompanied by higher volatility). I would pick KBWY over ROOF due to KBWY’s lack of mREIT exposure as well as its more consistent dividend history. Additionally, KBWY pays monthly, which could be a plus for some investors, whereas all of the other REIT funds pay quarterly. Finally, the prevailing worries over interest rate rises has caused the REIT ETFs to drop by about 10% from their recent highs, providing more attractive entry points to income investors. VNQ Total Return Price data by YCharts Disclosure: I/we have no positions in any stocks mentioned, and no plans to initiate any positions within the next 72 hours. (More…) I wrote this article myself, and it expresses my own opinions. I am not receiving compensation for it (other than from Seeking Alpha). I have no business relationship with any company whose stock is mentioned in this article.