Biotech Weekly: Position Management And What To Do When You’re In The Red
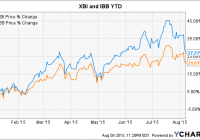
If a stock that you like drops even though the thesis for holding the stock has not been altered, consider it as an opportunity to add on weakness. BLUE presented a textbook example on Friday of when to add to a position when a stock is acting weak even though the bull thesis remains unchanged. Roka Biosciences may come in with weak Q2 earnings, which would be a great buying opportunity as the thesis is built on H2 sales momentum with the improved listeria assay. Completing thorough due diligence before buying allows you to properly manage your position and provides you the conviction to add to your position on weakness. Welcome to this week’s edition of Biotech Weekly. The past week was rough for biotech investors with the iShares NASDAQ Biotechnology ETF (NASDAQ: IBB ) declining 3.6% and the more small cap SPDR Biotech ETF (NYSEARCA: XBI ) dropping 7.1%. With the rough action, both the IBB (-0.1%) and the XBI (-6.0%) are now down for the quarter, though its important to note that they are both still up significantly year-to-date. XBI data by YCharts With the recent volatility in both small and mid cap names, I’ve seen a number of biotech investors discussing making changes to their portfolios based on the profit/loss of their holdings. While I understand how it can be extremely frustrating to be underwater in a position, it is not smart or logical to make changes to your portfolio based on your unrealized gain/loss, with the one exception being strategic tax-loss trading near the end of the year. While unrealized gain/loss is a measure of how much you have lost or gained in market value since your original investment, it is not a pertinent statistic when considering the proper valuation of a security. I want to use this piece to discuss some of what I believe are important things to consider during the life of a holding and run through a few examples. When You Buy A Stock: By the time you purchase a stock, you should have completed the following tasks: Significant due diligence Review of pipeline assets and science supporting development Identification of near-term catalysts Research on the management team Consideration of the major investors in the stock Acknowledgement of companies with potentially competing treatments Thorough review of upside/downside depending on potential upcoming news Study of the capital structure Examination of the financial statements Understanding of cash runway Determining what the appropriate valuation is for the asset Thesis: From considering these factors above, you should be able to develop a thesis that explains your reasoning for holding the stock. This thesis should cover your belief why the stock will appreciate in value. Example #1: Roka Biosciences (NASDAQ: ROKA ): Back in November 2014, I looked into Roka Biosciences in some detail, but had concluded that it would be best to wait on the sidelines for another earnings report or two given that issues with false positives from the company’s Atlas Listeria LSP Detection Assay would hamper sales. After continuing to watch newsflow surrounding the company, seven months later at the end of June 2015, I highlighted Roka as a top name to buy and presented the following thesis: Pent-up sales demand for the company’s improved listeria assay projected to be cleared in July would fuel sales growth in H2 for this company trading under cash as of its last report with a solid management team and high institutional ownership that has held the stock during past weakness. Example #2: bluebird bio, Inc. (NASDAQ: BLUE ): For the second example, I wanted to present a more mainstream biotech that has experienced some recent significant volatility. Let’s discuss the example of an investor that purchased bluebird on June 24 at $170, the day after the company announced strong pricing for its common stock offering. Let’s present the following thesis that is probably similar to what many investors in bluebird believe: This gene therapy leader with a cash runway into 2018, has an exciting asset in LentiGlobin with two compelling indications (beta-thalassemia major and severe sickle cell disease) and potential data for both indications in December at ASH, an additional late-stage asset in Lenti-D, and numerous immuno-oncology collaborations likely to provide increased newsflow in 2016 presents the opportunity to invest in a new wave of technology progressing towards commercialization. Evaluating Your Position: Managing your position isn’t something that ends after you make a purchase. As an investor, your job has only begun. You are responsible for tracking how newsflow may affect the company and your thesis. If an event happens to disprove your thesis, you likely should be selling out and moving on. If the stock hits what you believe is the fair valuation and no longer presents an attractive risk/reward, you should be reducing/selling your position. Even if the stock has rallied a lot yet still presents a respectable valuation, there is nothing wrong with taking a little bit off the table, as no one has been hurt by taking a little profit. If the stock declines and your thesis remains intact, you should be adding to your position, not dumping your stock (“puking up” your position as traders say). I’ve never been a huge fan of stop losses as they can cause you to sell a stock in a market correction (such as what biotech has been experiencing recently) just because investors are going “risk-off” and not because of any company-specific news. Let’s walk through the two examples. Example #1: Roka Biosciences: Since buying ROKA in mid June, I saw the stock rise approximately 36% into a mid July announcement that the company had indeed received AOAC clearance for its improved listeria assay . I did not trim any of my position off over $3.50, as I firmly believe the stock has substantially more upside than this once the pent-up sales demand is released. I believe the stock has a good chance to return to the $8+ price per share levels where it traded before issues with false positives for its original listeria assay. When I saw the stock fade over the next few weeks, I asked myself if my thesis was still intact. After review, I determined that my thesis was indeed still intact, and the investment was actually derisked slightly given that the company had achieved the AOAC clearance. Given this, I decided to purchase more shares this month. That being said, I have been very clear that I expect Q2 sales to be poor. I started my position before Q2 earnings as I felt the current depressed valuation around cash levels, the AOAC clearance catalyst, and the potential for H2 sales momentum would provide some support and allow me to participate in upside if the company is indeed able to pull a rabbit out of its hat in terms of sales progress in Q2. Should shares drop on weak Q2 earnings, my thesis will remain intact, and this drop would be a great (and potentially last) buying opportunity. Example #2: bluebird bio, Inc.: After bouncing around between $155 and $170 per share after the offering, the stock declined from a high of $168.03 on August 6 to a low of $129.01 only a day later. So, what caused the stock to tank more than 23% in this short period of time? The company had provided its second quarter operating results in a press release on August 6 , but there wasn’t anything particular of note. The thesis I presented above remained fully intact. Selling merely appeared related to a risk-off theme of selling every biotech in sight, especially if they did not have a major catalyst this quarter. There’s no reason to sell the stock just because your profit/loss line in your account now shows you at a loss. An investor that had bought the stock after the most recent offering given the thesis I presented would certainly have been downright confused by the significant drop, but should have taken the drop as a gift and added to the bluebird position. Many investors certainly realized that the stock was being inappropriately beaten down as it proceeded to rally over 25 points in a half-day of trading. What type of stock has a 25-point intraday rally in a weak market? A stock that shouldn’t have been receiving a beating in the first place. Who was selling bluebird below 140? It certainly didn’t make sense for me. Those that had bought recently should have been adding if anything as their investment thesis likely remained intact. Those that bought the stock much lower should have been selling in the $160-170 range if they felt the stock was fairly valued, not dumping shares after a decline over 20% after parts of two trading days. Conclusion: Don’t jump into stocks until completing thorough due diligence. This through due diligence allows you to properly manage your position. Make sure to develop a solid thesis, which you can see play out by tracking newsflow. If a stock that you like and believe presents a reasonable valuation drops even though the thesis for holding the stock has not been altered (as we saw with bluebird on Friday), consider this an opportunity to add to your position on weakness, not blindly dump your shares as the stock declines for no significant company-specific reason Editor’s Note: This article covers one or more stocks trading at less than $1 per share and/or with less than a $100 million market cap. Please be aware of the risks associated with these stocks. Disclosure: I am/we are long ROKA. (More…) I wrote this article myself, and it expresses my own opinions. I am not receiving compensation for it (other than from Seeking Alpha). I have no business relationship with any company whose stock is mentioned in this article.

