Tag Archives: health

The Sources Of Volatility And The Challenge For Active Management

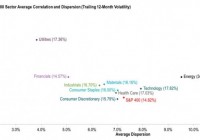
By Craig Lazzara, Global Head of Index Investment Strategy If we needed a reminder of the continuing volatility of the world’s financial markets, the first weeks of 2016 obliged us by providing one. What’s often overlooked, especially when volatility spikes, is that there are two distinct sources of volatility . Understanding them can not only enhance our appreciation of market dynamics, but also provides some important insights for portfolio managers. The two components are correlation and dispersion . Correlation, the more familiar of the two, is a measure of timing . Correlations within an equity market are, in our experience, invariably positive , indicating that stocks tend to move up and down together. As correlations rise and diversification effects diminish, the co-movement of index components is heightened, and market volatility increases. Dispersion, on the other hand, is a measure of magnitude : it tells us by how much the return of the average stock differs from the market average. In a high dispersion environment, the gap between the market’s winners and losers is relatively large. Given positive correlations, as dispersion rises, the market’s gyrations will take place within wider bands – and volatility will increase. The chart below illustrates the cross-sectional interaction of dispersion, correlation, and volatility using the sectors of the S&P 400 . The numbers in parentheses show the last 12 months’ volatility for each sector. Energy, unsurprisingly, was the most volatile sector, driven largely by its very wide dispersion. The Financials sector was the index’s least volatile. Notice that the volatility of Utilities (17.4%) and Health Care (17.0%) were more or less the same. Yet their volatility came from different sources . Utility volatility is correlation-driven; the gap between the sector’s winners and losers is low, producing low dispersion, but the winners and losers are highly likely to move together, producing high correlation. Health Care’s volatility comes from the opposite direction – from low correlation, meaning that the sector’s components tend to move more independently, but with higher dispersion, indicating a bigger gap between winners and losers. The sources of sector volatility have important implications for active managers: For a sector like Utilities, stock selection should be a relatively low priority. Low dispersion means that the gap between winners and losers is relatively low; this reduces the value of an analyst’s skill . For Health Care (and other high-dispersion sectors), the situation is different – the opportunity to add (or to lose) value by stock selection is relatively large. If research resources are constrained, this is where they should be concentrated. The nature of the research question is fundamentally different for these two sector types. For Utilities, the sector call is important, the stock selection decision much less so. For Health Care, the stock selection decision is more critical. An investor who understands the sources of volatility is more likely to be successful at managing and exploiting it. Disclosure: © S&P Dow Jones Indices LLC 2015. Indexology® is a trademark of S&P Dow Jones Indices LLC (SPDJI). S&P® is a trademark of Standard & Poor’s Financial Services LLC and Dow Jones® is a trademark of Dow Jones Trademark Holdings LLC, and those marks have been licensed to S&P DJI. This material is reproduced with the prior written consent of S&P DJI. For more information on S&P DJI and to see our full disclaimer, visit www.spdji.com/terms-of-use .
Biotech On The Edge? Try Better-Performing Healthcare ETFs

Issues in winter 2016 are similar to those in summer 2015. Like China, the U.S. biotech space went berserk in the first week of 2016 with the Nasdaq Biotechnology index losing over 8.7%. With this, the sector snapped the winning momentum of the last four years (an average 7% return ). One of the reasons behind the slump was the Chinese stock market rout that stemmed from soft economic data and its ripple effect on other asset classes. Though there is no direct correlation between the Chinese market and the U.S. biotech space, the flight to safety was prevalent in the first week of 2016. Investors fled the high-growth and high-momentum investing areas like biotech and parked their money in the safe-haven assets. Additionally, a host of early-stage companies chose secondary stock offerings at discounted prices last week. Now, stock prices tend to swing when publicly offered. In fact, fresh issuance dilutes the shares and lowers their value. This is especially true when the stocks are sold at deep discounts to the current market price. As per analysts, Akebia Therapeutics (NASDAQ: AKBA ) and Epizyme (NASDAQ: EPZM ) priced their stocks at $9 each, down 36.6% and 68.4% respectively from their 52-week highs. In any case, biotech stocks have long been guilty of overvaluation. Even after the sell-off, the biggest biotech ETF the iShares Nasdaq Biotechnology (NASDAQ: IBB ) trades at 22 times P/E (ttm) compared with 17 times P/E of the SPDR S&P 500 ETF (NYSEARCA: SPY ) . Yes, the sector holds a lot of promise, but occasional risk-off trade sentiments and overvaluations are threats to it. Though we believe that after such a steep sell-off, biotech stocks will rebound in the coming days, it is wise for value investors to take some rest off biotech stocks and ETFs, and instead turn their attention towards the more stable, diversified but equally promising broader healthcare ETFs. Inside Broader Healthcare Space The broader healthcare sector is also full of strength. A whirlwind of mergers and acquisitions, promising industry fundamentals, plenty of drug launches, growing demand in emerging markets, ever-increasing healthcare spending and Obama care play major roles in making it a lucrative bet for the long term. Moreover, healthcare is said to be recession-proof in nature. As a result, in the recent market rout, the following healthcare stocks were less damaged and lost in the range of 3-5.4% compared with 16.5% losses at the BioShares Biotechnology Clinical Trials ETF (NASDAQ: BBC ) . Let’s take a look at the healthcare ETFs that resisted the recent wild sell-offs to a large extent. Investors should note that most of the following healthcare ETFs hold a Zacks ETF Rank #1 (Strong Buy). iShares US Healthcare Providers ETF (NYSEARCA: IHF ) This ETF provides exposure to 50 companies that provide health insurance, diagnostics and specialized treatment by tracking the Dow Jones U.S. Select Healthcare Providers Index. About half of the portfolio is dominated by managed care firms while healthcare services and healthcare facilities round off the top three. The fund has amassed $681.8 million in its asset base while charging 45 bps in annual fees. IHF fell nearly 3.63% in the first week of 2016 and has a Zacks ETF Rank of 1. iShares Global Healthcare ETF (NYSEARCA: IXJ ) This $1.45-billion global healthcare ETF holds 90 stocks. Pharma, biotech and life sciences have three-fourth of the share while the rest is occupied by healthcare equipment and services. The fund is heavy on the U.S. (65.7%) followed by Switzerland (11%). The product charges 48 bps in annual fees and lost 3.4% in the last five trading sessions (as of January 8, 2016). Health Care Select Sector SPDR ETF (NYSEARCA: XLV ) The most popular healthcare ETF follows the Health Care Select Sector Index. This large cap centric fund manages about $13.2 billion in its asset base. Expense ratio comes in at 0.14%. In total, the fund holds 58 securities in its basket. Pharma accounts for 38.7% share from a sector look while biotech (24.1%), healthcare providers and services (18.6%), and equipment and supplies (13.9%) make up for a double-digit exposure each. The Zacks Rank #1 fund was off 3.6% in the first week of 2016. iShares U.S. Medical Devices ETF (NYSEARCA: IHI ) The fund has amassed about $720 million in assets invested in 50 stocks. Healthcare equipment has around 85.8% exposure followed by life sciences (13%). The fund charges 45 bps in fees. The fund lost about 4% in the last five trading sessions (as of January 8, 2016). Original Post

7 Ways To Gauge Growth And Evaluate Value

Growth and value are cornerstones of fundamental analysis. Here we explore some of the most popular methods of gauging a company’s growth and a stock’s value. “Growth” and “value” are thought of as two very significant metrics in the world of fundamental analysis , two things that can cause a trader to buy, sell, or ignore. But what is growth? And what is value? These are words we hear and read every day, and that most people think they can easily define. You might think that a musician’s songwriting has grown, or you might give (or get) what you believe to be valuable advice. But in both of these instances, growth and value are subjective-matters of perception. But when it comes to the markets, growth and value are not so subjective. Rather, they are things that, for the most part, can be measured or weighed. Growth refers to a company’s performance, whereas value applies to its stock price. Moreover, there are very specific ways of gauging growth and value. Here we’ll discuss seven popular ways of doing just that. GROWTH: Past, Present, and Future. In simple terms, growth describes earnings. There are three different ways of looking at those earnings: past, present, and future. 1. The Past: Historical Growth As the common disclaimer goes, “past performance is not indicative of future results.” And as true as that may be, it doesn’t mean that it’s not good to know a company’s past. With that in mind, many traders and investors look at a company’s historical growth, which is really just a catchy way of describing the company’s annualized earnings in the past. When there exists a consistent increase in annualized earnings, there exists historical growth. 2. The Present: Free Cash Flow When it comes to measuring growth (or growth potential), some traders and investors like to follow the cash or, more specifically, the free cash flow. Free cash flow is, put simply, the difference between cash in and cash out. When there’s significantly more cash coming in, the free cash flow is strong. When the cash coming in is close to (or less than) the cash going out, the free cash flow is weak. Companies with strong free cash flow may have capital for R&D, acquisitions, etc. In other words, things that may very well help it grow. 3. The Future: Projected Growth If you’re going to look back, you may also want to look ahead. But where a company’s historical growth can be calculated by looking at their past performance data, a company’s projected growth is determined by analysts who look at a variety of information, including a company’s current and recent finances, as well as its stated objectives and outlooks. VALUE: Price Comparisons Growth places a heavy emphasis on, of course, growing. Value, however, does not. (After all, not every company aims to keep expanding, or even growing, its earnings. Some companies, whether they want to or not, just stay relatively consistent.) Value looks at the price of the company’s stock relative to the performance of the company, regardless of whether or not the performance is improving. Here are four popular ways of gauging the value of a stock. 1. Price to Earnings Ratio (P/E) This metric takes the stock’s price and compares it to the company’s earnings. It does that by dividing the stock price by the earnings per share (EPS). A “normal” P/E ratio is typically 20-25 times higher than the EPS. So a stock with a “normal” P/E ratio may be trading at $20/share, and have an EPS of $1/share. In this case, the P/E ratio is 20. Perhaps you can see where this is going: If a company is earning more money per share, but it’s not reflected in the stock price, the P/E ratio can be low (lower than 20), and this can suggest that a stock is undervalued (and thus, may be a good buy). For example, remember the example stock that was trading at $20? Now, let’s say its EPS is $5. The P/E ratio for that stock would be 4, which may suggest the stock price should go up to reach normal range. Or, consider the reverse: the stock is trading at $20, but the company is only earning $0.50/share. Now it has a P/E ratio of 40, which suggests the stock may be overvalued. 2. Price to Book Ratio (P/BV) To arrive at this measurement, you have to consider a hypothetical, which is to say, you have to know its book value. A company’s book value is the theoretical amount that every share would be worth if the company were to be completely liquidated. That number is then compared to the actual share price of the company. The result is the P/BV, or Price to Book Ratio. If the ratio is low (meaning the price is lower than the book value), the stock may be undervalued. 3. Price to Sales Ratio (P/S) How does a company make money? One major way is by selling, some in a traditional retail sense, and others in a more abstract sense (by selling its ideas or services). Regardless, since sales are often a significant source of money for a company, many traders and investors like to compare a company’s sales to its stock price. Here they do this by actually breaking down the sales to a per-share amount. With this figure, they formulate the Price to Sales Ratio. Like the above two ratios, a comparatively low stock price means a low ratio, which may be indicative of an undervalued stock. 4. Dividend Yield and Historical Rate of Dividend Growth Since dividends are cash payouts that companies pay their shareholders, dividends can be an important thing to many traders and investors. For one thing, dividends can allow a shareholder to earn income without actually selling the stock. And for another, the amount of dividends can be a good indicator of the health of the company. To take a deeper look, many users of fundamental analysis will look at a company’s dividend payment history. Consistent and increasing dividends may be a sign of a strong company, and a stock price that has not grown along with those dividends may be a sign of an undervalued stock. So, in the end, when you think about growth and value, think about these seven points. For growth, there’s the past, the present, and the future. And when it comes to value, do price comparisons-against earnings, against book value, against sales, and against dividend yields. Disclosures Schwab does not recommend the use of technical analysis as a sole means of investment research. The information here is for general informational purposes only and should not be considered an individualized recommendation or endorsement of any particular security, chart pattern or investment strategy. Past performance is no guarantee of future results. ©2015 Charles Schwab & Co., Inc. ( Member SIPC ) All rights reserved. (0614-4161)