Tag Archives: hdlv

Happy 1-Year Birthday HDLV And Quarterly Rebalance: Altria Out, CME In

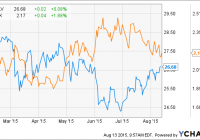
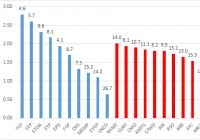
Summary HDLV has recently turned one year old and its performance since inception appears adequate, though data sources have been conflicting. The quarterly rebalance removed blue-chip favorites MO, VTR and ED, while introducing newcomers CME, PPL and WY. HDLV currently yields 9.7% on a 2x leveraged portfolio. HDLV: a one year review The ETRACS Monthly Pay 2xLeveraged US High Dividend Low Volatility ETN (NYSEARCA: HDLV ), incepted on Sep. 30, 2014, has recently turned one year old. Since inception, it (12.43%) has slightly underperformed two other 2x dividend ETNs, the Monthly Pay 2xLeveraged Dow Jones Select Dividend ETN (NYSEARCA: DVYL ) (13.66%) and the Monthly Pay 2xLeveraged S&P Dividend ETN (NYSEARCA: SDYL ) (12.72%), while outperforming the Monthly Reset 2xLeveraged S&P 500 Total Return ETN (NYSEARCA: SPLX ) (7.48%). Note that all of the 2x funds mentioned above reset their leverage monthly, rather than daily. The total return performances of the aforementioned fund since the inception of HDLV in Sep. 2014 are shown below, with the unlevered SPDR S&P 500 Trust ETF (NYSEARCA: SPY ) (4.96%) shown for comparison. HDLV Total Return Price data by YCharts In terms of volatility, HDLV appears to have done the worst out of all the 2x leveraged funds. This is disappointing because HDLV purports to hold stocks that show lower volatility than the broader market. Part of this could be due to HDLV’s heavy concentration in interest rate-sensitive sectors such as telecommunications and tobacco (refer to my HDLV update article ” 10%-Yielding HDLV May Be A Good Choice If Interest Rates Remain Low “), which moved together during the significant interest rate gyrations witnessed throughout this year. HDLV 30-Day Rolling Volatility data by YCharts Interestingly, InvestSpy gives different results on both total return and volatility. According to InvestSpy, HDLV has produced both the highest total return and lowest volatility out of the four 2x leveraged funds since inception (note that the high volatility of SPLX may be distorted by its lack of liquidity). Related to this, HDLV also shows the lowest beta and daily variation. Moreover, HDLV produced the lowest maximum drawdown out of the four 2x leveraged funds. Ticker Annualized Volatility Beta Daily VaR (99%) Max Drawdown Total Return HDLV 24.50% 1.19 3.60% -18.00% 17.10% SDYL 26.80% 1.39 3.90% -21.40% 14.10% DVYL 26.60% 1.5 3.90% -22.90% 14.70% SPLX 72.30% 1.46 10.60% -29.20% 10.20% I wanted to confirm the data using a third source of information, but unfortunately Morningstar does not give volatility data or Sharpe ratios on issues less than 3 years old. Therefore, depending on the source of data used, HDLV could either be ranked first or third out of the four 2x leveraged funds for total return, and either first or last in terms of volatility. This could be due to differences in the way that total return and volatility is calculated for the different data providers. HDLV has also recently just paid out its 12th dividend since inception, giving it a TTM yield of 9.7%. HDLV quarterly rebalance: Altria out, CME in As has been described in my previous article ” Higher Dividends With Less Risk (Part 2): A Second Look At ETRACS 2x US High Dividend Low Volatility ETN “, HDLV applies both dividend yield and volatility screens in selecting constituents. The selected constituents are then weighted according to average trading turnover, a factor that correlates closely with market capitalization. The result is a highly focused portfolio, with over 60% of the fund being concentrated in the Top 10 holdings. Given this high concentration of holdings, I believe that it is worthwhile to analyze individual additions and removals to the index when it is rebalanced each quarter in order to give some insight into the nature of the portfolio. The latest quarterly rebalance was performed last week, and allocates 60.21% of the index to the Top 10 holdings. The following table shows the Top 10 constituents of HDLV for the previous quarterly rebalance (Jul. 17, 2015) compared to the most recent rebalance (Oct. 16, 2015). Oct. 22, 2014 Jul. 17, 2015 Name Ticker Weighting / % Name Ticker Weighting Verizon Communications Inc. (NYSE: VZ ) 10.00 Verizon Communications Inc. VZ 10.00 AT&T Inc. (NYSE: T ) 10.00 AT&T Inc. T 10.00 Philip Morris International (NYSE: PM ) 8.87 Philip Morris International PM 9.60 Duke Energy Corp (NYSE: DUK ) 6.61 Altria Group Inc. MO 8.61 Southern Co (NYSE: SO ) 6.16 Duke Energy Corp DUK 6.82 Welltower (formerly Health Care REIT) (NYSE: HCN ) 4.11 Southern Co SO 5.87 CME Group Inc (NASDAQ: CME ) 4.11 Ventas Inc (NYSE: VTR ) 3.92 PPL Corp (NYSE: PPL ) 3.98 Health Care Reit Inc (now Welltower) HCN 3.72 HCP Inc (NYSE: HCP ) 3.51 Consolidated Edison Inc (NYSE: ED ) 3.44 Weyerhaeuser Co (NYSE: WY ) 2.86 HCP Inc 3.17 Top 10 total 60.21 65.15 What are the major changes in this rebalance? Key additions. CME, PPL and WY have entered the top 10, and were newly added to the fund this quarterly rebalancing review. Key removals. MO, VTR and ED were removed from the top 10, and from the fund altogether this quarterly rebalancing review. The removal of MO is particularly significant because this constituted 8.61% of the total weight of the fund. As an owner of HDLV, I was interested to find out why MO was removed while peer PM was not, why VTR was removed but peers HCN and HCP were not, and why ED was removed by peers DUK and SO were not. MO vs. PM Over the past 3 months, MO has significantly outpaced PM on a price basis. MO data by YCharts This has caused MO’s dividend yield to drop to around 3.5%. Thus, I believe that MO was excluded from the index because it was not among the top 80 names by dividend yield (amongst the top 200 largest US companies). MO Dividend Yield (TMM) data by YCharts VTR vs. HCN and HCP On a price only basis, VTR has performed comparably with HCN and HCP over the past 3 months. Its yield also sits between that of HCP and HCN. VTR Dividend Yield (TTM) data by YCharts Moreover, VTR’s volatility over the past 12 months has been similar to its peers – recall (from my previous article) that HDLV selects 40 of the lowest-volatility stocks out of the aforementioned 80. VTR 30-Day Rolling Volatility data by YCharts When considering market cap, VTR’s market cap is smaller than HCN’s, but larger than HCP’s, thus I do not think that this was the factor for exclusion. Therefore, I do not know why VTR was excluded from the newest edition of HDLV, while HCN and HCP were not. My suspicion is that Solactive, the index provider, did not account for VTR’s spin-off of Care Capital Properties (NYSE: CCP ) properly, leading to aberrant yield or volatility statistics that disqualified it for inclusion. If so, that is a disappointment because I feel that VTR deserves to be included in this fund, according to my analysis of the index guidelines. ED vs. DUK and SO ED has outperformed DUK and SO over the past 3 months. Similar to the situation with MO, ED could have been removed from its index due to its declining dividend yield. ED Dividend Yield (TMM) data by YCharts The new Top 10 additions, CME, PPL and WY have TTM yields of 4.3%, 4.3% and 4.1%, respectively, all higher than ED. Summary While the removal of blue-chip favorites such as MO and ED from the index can be disappointing to some, investors may be somewhat comforted by the fact that the fund is simply “selling high and buying low” as it removes companies whose price has appreciated to such an extent that their yield falls below the threshold, while replacing these with higher-yielding companies whose recent fortunes may not have been as auspicious. At the same time, the fact that only the top 200 U.S. companies by market cap are considered for selection may limit, but not entirely prevent, “falling knife” situations in which an incredibly high yield can be a predictor for an imminent dividend cut. While HDLV does not screen for dividend growers, it is noteworthy that all companies in their Top 10 have positive year-on-year dividend growth (PPL squeaks by with 0.3% 1-year DGR). Moreover, the decision to exclude MLPs from the index, in spite of the massive MLP bull market that occurred until collapse in late 2014, appears to be brilliant in hindsight. On the other hand, the removal of VTR appears, as far as I can tell, to be a mistake. In terms of portfolio concentration, I feel that this quarterly rebalance has improved the diversification of HDLV. The Top 10 holdings account for 60.21% of the portfolio, down from 65.15%. In the Top 10, there is now only 1 tobacco company instead of 2, and only 2 healthcare REITs instead of 3. This leaves room for the addition of CME, one of the largest options and futures exchanges, and WY, one of the world’s largest private owners of timberlands. Meanwhile, the addition of PPL to the Top 10 at the expense of ED would be considered a wash. In terms of performance since inception just over one year ago, HDLV has done either better or worse than two other 2x dividend ETNs, SDYL and DVYL, depending on whether YCharts or InvestSpy is used, while it has performed better than SPXL according to both data sources. Its volatility has either been the best or the worst among the four funds, depending again on which data is considered. Finally, HDLV’s TTM dividend yield is 9.7%, which is significantly higher than SDYL at 5.8% and DVYL at 7.6%.

10%-Yielding HDLV May Be A Good Choice If Interest Rates Remain Low

Summary HDLV is filled with blue-chip cash-generating machines. The recent mini-“Taper tantrum” sparked a sell-off in dividend stocks. HDLV is up only 12% from its 52-week lows and may be a good choice if interest rates don’t rise. Introduction In December of 2014, I comprehensively analyzed the methodology and composition of the ETRACS Monthly Pay 2xLeveraged US High Dividend Low Volatility ETN (NYSEARCA: HDLV ), a fund that was only incepted a few months prior. HDLV is a 2x leveraged fund that seeks to hold U.S. companies that possess both a high yield and low volatility. Readers may refer to my previous article for more detailed information on the methodology and composition of this fund. The recent mini-“Taper tantrum” has sparked a sell-off in dividends stocks, particularly those deemed to bond-like. Not surprisingly, this includes many of the top constituents in HDLV, which include blue-chip cash-generating machines such as Verizon Communications (NYSE: VZ ), AT&T (NYSE: T ), Philip Morris (NYSE: PM ), Altria Group (NYSE: MO ) and Duke Energy (NYSE: DUK ). As HDLV is nearly one-year old, this article seeks to provide an update on HDLV to see if it has been able to meet its dual mandate of high dividends and low volatility. Recent performance The graph below shows the price of HDLV and the yield of the 10-year treasury note since February of this year. We can see from the chart that the two lines move in opposite directions, suggesting that the recent price action of HDLV (or rather, its underlying constituents) has been driven by investor fixation on interest rates rather than any material change in the fundamentals of the companies. Interest rates have fallen again over the last two months, allowing HDLV to rise around 12% from its 52-week lows. HDLV data by YCharts How has HDLV performed relative to the broader market? HDLV is a 2X leveraged ETN that tracks twice the monthly performance of the underlying index, which has been considered to be a strategy that reduces the “beta decay” of leveraged securities. Therefore, the performance of HDLV since inception is compared to the UBS ETRACS Monthly Reset 2xLeveraged S&P 500 total Return ETN (NYSEARCA: SPLX ), and the Direxion Monthly NASDAQ-100 Bull 2X Fund (MUTF: DXQLX ), which track twice the monthly return of S&P 500 and NASDAQ-100, respectively. The chart above shows that DXQLX has had by far the best total performance. Although HDLV has recently underperformed, its total return since inception is still slightly higher than that of SPLX. Volatility Has HDLV managed to exhibit lower volatility than the broader market? Unfortunately, as SPLX is not very liquid, its volatility data is distorted by the high bid-ask spreads on the instrument. Therefore, I used the ProShares Ultra S&P 500, a daily-resetting 2X leveraged version of the SPDR S&P 500 Trust ETF ( SPY), instead. The graph below shows the 30-day rolling volatility of HDLV and the ProShares Ultra S&P 500 ETF (NYSEARCA: SSO ) since Nov. 2014. HDLV 30-Day Rolling Volatility data by YCharts The graph above shows that for slightly over half the time, HDLV has had a lower volatility than SSO, suggesting that is has been less volatile than the broader market. This data is corroborated by InvestSpy , which shows HDLV having significantly lower volatility and beta compared to SSO since inception. One area where HDLV appears to underperform SSO is in its maximum drawdown of -14.50% compared to -10.40% for SSO. However, the maximum drawdown figures may not be directly comparable because HDLV resets its leverage monthly whereas SSO resets daily. Ticker Annualized Volatility Beta Daily VaR (99%) Max Drawdown Total return HDLV 21.70% 1.13 3.20% -14.50% 14.60% SSO 25.20% 2 3.70% -10.40% 15.80% SPY 12.60% 1 1.90% -5.30% 9.00% Composition Since my last article in December of 2014, HDLV has undergone three rebalancing events (in January, April and July). The table below shows the top 10 constituents of HDLV in Dec. 2014 and Aug. 2015. Dec. 2014 Aug. 2015 Name Ticker Weighting / % Name Ticker Weighting ConocoPhillips (NYSE: COP ) 10.11 Verizon Communications Inc. VZ 9.89 Verizon Communications Inc. VZ 10.01 AT&T Inc. T 9.55 AT&T Inc. T 9.77 Philip Morris International PM 9.42 Philip Morris International PM 9.20 Altria Group Inc. MO 8.87 Altria Group Inc. MO 7.62 Duke Energy Corp DUK 6.89 Duke Energy Corp DUK 5.84 Southern Co SO 6.18 Southern Co (NYSE: SO ) 5.04 Ventas Inc (NYSE: VTR ) 4.06 Health Care Reit Inc (NYSE: HCN ) 3.90 Health Care Reit Inc HCN 3.70 PPL Corp (NYSE: PPL ) 3.34 Consolidated Edison Inc (NYSE: ED ) 3.68 Entergy Corp. (NYSE: ETR ) 3.11 HCP Inc (NYSE: HCP ) 3.29 Top 10 total 67.94 65.53 We can see that 7 companies, namely VZ, T, PM, MO, DUK, SO and ECN, have remained in the top 10 of constituents of HDLV since 8 months ago. 3 companies have been removed from the top 10 of constituents, including the former top holding COP, as well as PPL and ETR. Meanwhile, VTR, ED and HCP have joined the top 1o constituents of HDLV. Moreover, and as mentioned in my previous article, HDLV is a very top-heavy fund. The top 10 constituents currently account for 65.53% of the total assets of the fund, down slightly from 67.94% in Dec. 2014. As a counterpoint, given that the names in the top 10 are all blue-chip, cash-generating, “widow-and-orphan” stocks, this underdiversification of companies does not unduly worry me. However, what maybe a cause for concern is the underdiversification of sectors . The top 10, or 65.53% of the fund, is entirely concentrated into telecommunications (T, VZ), tobacco companies (PM, MO), utilities (DUK, SO, ED) and healthcare REITs (VTR, HCN and HCP). These sectors are quite interest-rate sensitive, and thus may all decline together when (if?) rates rise, or conversely move up together when rates fall, as has been the case for the past year. Dividends HDLV has paid out 10 dividends since inception, as shown in the chart below. These distributions sum up to $2.12, which based on the current price of $26.64 and annualized to 12 months represents a yield of 9.57% . Risks HDLV charges a management expense ratio of 1.45%, which constituents of a tracking error of 0.85% and a surreptitiously hidden financing spread of 0.60%. This is added to the three-month LIBOR of 0.31% to give a total expense ratio of 1.76%. While this seems high, keep in mind that owning HDLV allows you to effectively control 2X of assets. Therefore, dividing the total expense ratio of 1.76% by 2 gives an effective expense ratio per dollar of assets controlled of 0.88%. If we don’t include the LIBOR in the expense ratio, the effective expense ratio (-LIBOR) is 0.73%. While this is still higher than other popular dividend ETFs such as the iShares Select Dividend ETF (NYSEARCA: DVY ) (0.39%), the SPDR S&P Dividend ETF (NYSEARCA: SDY ) (0.35%) and the Vanguard Dividend Appreciation ETF (NYSEARCA: VIG ) (0.10%), the ability to access cheap leverage may still make this fund more cost-effective for investors than buying on margin themselves. Additionally, and as mentioned above, the constituents of HDLV are quite interest-rate sensitive, and so this fund will likely decline if interest rates spike higher. Finally, as HDLV is an ETN, it is subject to the credit risk of the issuer, in this case UBS. Conclusion I believe that HDLV has been able to meet its dual mandate of high and dividends and low volatility over the past 12 months. Investors who believe that low interest rates are here to stay for longer will be attracted to the blue-chip, income-generating nature of the top constituents of HDLV. The 2X leveraged nature of HDLV has pushed its trailing yield to 9.57% (annualized from 10 months). Moreover, HDLV is currently up only around 12% from its 52-week lows, which may be an attractive entry point for initiating a position. On the other hand, drawbacks of this fund are its overconcentration in companies and sectors, and its sensitivity to interest rates. Readers interested in other high-dividend low-volatility funds may peruse my previous articles on the PowerShares S&P 500 High Dividend Portfolio ETF (NYSEARCA: SPHD ) and the Global X SuperDividend U.S. ETF (NYSEARCA: DIV ). Disclosure: I/we have no positions in any stocks mentioned, but may initiate a long position in HDLV over the next 72 hours. (More…) I wrote this article myself, and it expresses my own opinions. I am not receiving compensation for it (other than from Seeking Alpha). I have no business relationship with any company whose stock is mentioned in this article.

Higher Dividends With Less Risk (Part 3): Global X SuperDividend U.S. ETF

Summary This is the third piece in this series of articles looking at high-dividend low-volatility funds. DIV tracks the INDXX SuperDividend U.S. Low Volatility Index. How does the composition of DIV compare to other high-dividend low-volatility funds HDLV and SPHD, and to the popular “quality” ETF DVY? Introduction High-income strategies and funds have exploded in popularity in recent years as the low-interest rate environment has prodded yield-starved investors to seek richer, and perhaps more risky, sources of income. Earlier this month, investors who sought higher yields in junk bonds and emerging market debt experienced a mini-correction as the crash in oil prices sparked fears that energy or energy-related companies (or countries!) could become insolvent. High-yielding securities can also be found within the realm of equities. Several classes of stocks have historically paid out high distributions, such as real estate investment trusts [REITs], mortgage REITs, business development companies [BDCs] and master limited partnerships [MLPs]. Similar to bonds, higher-yielding companies are often perceived to carry higher risk. In the first two articles of this series, we examined the PowerShares S&P 500 High Dividend Portfolio ETF (NYSEARCA: SPHD ) (article here ) and UBS’s ETRACS 2xLeveraged U.S. High Dividend Low Volatility ETN (NYSEARCA: HDLV ) (article here ) and compared these with each other and with popular “quality” dividend ETFs such as Vanguard Dividend Appreciation ETF (NYSEARCA: VIG ), Vanguard High Dividend Yield ETF (NYSEARCA: VYM ) and Schwab U.S. Dividend Equity ETF (NYSEARCA: SCHD ). We found that SPHD and HDLV were able to meet their dual objectives of higher dividends with lower volatility by favoring more defensive sectors such as utilities, telecommunications, and REITs. In what is likely to be the final article of this series, we will examine the Global X SuperDividend U.S. ETF (NYSEARCA: DIV ) and compare it with the other funds of its class, HDLV and SPHD. Additionally, the iShares Select Dividend ETF (NYSEARCA: DVY ) will represent a “quality” dividend ETF for comparative purposes. Global X SuperDividend U.S. ETF DIV debuted in March 2013, and tracks the INDXX SuperDividend U.S. Low Volatility Index, which was launched in February, 2008. Meanwhile, HDLV tracks the Solactive U.S. High Dividend Low Volatility Index and SPHD tracks the S&P 500 Low Volatility High Dividend Index. DVY tracks the Dow Jones U.S. Select Dividend Index. Fund details Details for the four dividend funds are shown in the table below (data from Morningstar ). Note that HDLV is a 2X leveraged ETN and the yield listed is the 2X leveraged yield.   DIV HDLV SPHD DVY Yield 5.59% 9.31%* 3.30% 2.52% Payout schedule Monthly Monthly Monthly Quarterly Expense ratio 0.45% 0.85%^ 0.30% 0.39% Inception Mar 2013 Sep 2014 Oct 2012 Nov 2003 Assets $299M $28M $255 $15.7B Avg Vol. 80K 20.6K 45K 745K No. holdings 50 40 50 100 Annual turnover 20% (unknown) 47% 22% *Estimated yield from 2X the weighted average yield of constituents (4.66%). ^Does not include financing fee (LIBOR + 0.60%). DVY is one of the oldest dividend ETFs on the market. It has a massive $15.7B in assets, would be large enough to qualify it as a large-cap company. DIV, SPHD and HDLV are much smaller funds, with DIV being the largest at $299M. The liquidity for DIV is respectable, at 80K shares. DIV has a reasonable expense ratio of 0.45%, which is slightly higher than DVY’s (0.39%). SPHD has the lowest expense ratio of 0.30% while HDLV’s is the highest at 0.85% (does not include financing fee). DIV also has the highest dividend yield of 5.59% out of the four dividend funds. HDLV’s 1X yield is 4.66% while SPHD has a 3.30% yield. DVY has the lowest yield of 2.52%. Methodology The methodology for the INDXX SuperDividend U.S. Low Volatility Index is shown in the steps below (source: INDXX ). Select U.S. companies that trade on the U.S. stock exchanges that fulfill the following requirements: market cap > $500M, daily turnover > $1M, public float > 10%, beta 50% dividend cut in the previous year. MLPs and REITs are included but BDCs are excluded. Rank eligible stocks by dividend yield. The top 200 yielding companies form the “selection pool”. The 50 companies with the highest yields are chosen for inclusion into the index and are equally weighted. Every quarter, remove companies with dividend cuts or negative dividend outlooks and replace with another company in the selection pool (weightings are unchanged). Every year, reconstitute the index using the above methodology. How does this methodology compare to the other two high-dividend low-volatility ETFs? For easier comparison, I have put the data into a table.   DIV HDLV SPHD Universe U.S. companies on U.S. exchanges with market cap > $500M, trading volume > $1M, public float > 10%, beta 50% dividend cut in the previous year. BDCs are excluded. Top 200 market cap names for U.S. companies on U.S. exchanges with market cap > $1B and trading volume > $15M. MLPs are excluded. S&P 500 Primary screen (yield) Select top 50 companies with the highest dividend yield Of those 200, select top 80 with the highest forward distribution yield Of those 500, select top 75 stocks with highest 12-month trailing yields, with the number of stocks from each GICS sector capped at 10 Secondary screen (volatility) (Beta