Tag Archives: handle

3 ETF Investing Themes For A Wobbly U.S. Bull

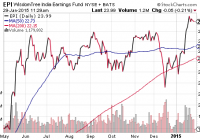
The Fed explains that it is serious about raising interest rates in 2015. Janet Yellen’s Fed expressed confidence that in spite of the failure of QE3 and ZIRP to influence rising prices, those rising prices should gradually reach the target of 2% in a tightening cycle. There are perhaps three investment themes that make sense at this point in the late stage U.S. bull market. Presumably, the Great Recession ended in June of 2009. Three months earlier on March 9, the stock market anticipated the modest recovery that is still intact. In essence, stocks began to rally well in advance of the actual turnaround in the U.S. economy. Similarly, the 10/09/2002-10/09/2007 bull market ended roughly three months before the start of the mammoth economic collapse (12/2007). In a sense, stock barometers were (and are) leading indicators of things to come. For those who wish to believe that stocks will avoid a 20%-plus bearish setback on a combination of monetary policy gamesmanship and perceived economic strength, they might want to consider the history of recessions as well as the history of central bank stimulus. With some 50-odd contractions over the last 225 years, one should expect expansions to falter, on average, every four-and-a-half years. The current recovery? Five-and-a-half and counting. It is also worth noting that past recessions required the U.S. Federal Reserve to lower overnight lending rates by 3%-4% to combat recessionary forces. Even if the Fed manages to get the Fed Funds rate up to 0.5% in 2015 – even if policymakers succeed in pushing it up to a “whopping” 1% in 2016 – wouldn’t they have to return to 0% and more quantitative easing (QE) when the inevitable economic contraction returns? Central bank QE as well as zero percent interest rates (ZIRP) have lowered the costs to service higher household and government debts ; they have increased the rewards for risk-taking in real estate as well as as market-based securities. Yet these policies have not done a great deal to assure prosperity, as median household income is lower than it was in the heart of the Great Recession. Equally troubling, survey stand-out Gallup determined that business closings have exceeded the number of new businesses created each year since 2008. According to some analysts , the opening/closing business data may even be responsible for the Bureau of Labor Statistics ( BLS ) overstating job growth by as much as 600,000 jobs annually. Nevertheless, the Fed explains that it is serious about raising interest rates in 2015. Stock bulls used to relish this type of optimism, particularly with respect to jobs. (You might want to ask the workers at Schlumberger (NYSE: SLB ), IBM (NYSE: IBM ), Haliburton (NYSE: HAL ), American Express (NYSE: AXP ) and U.S. Steel (NYSE: X ) if they share the sentiment.) And then there is the reality that inflation has remained below its 2% target for 30-plus months. Janet Yellen’s Fed expressed confidence that in spite of the failure of QE3 and ZIRP to influence rising prices, those rising prices should gradually reach the target of 2% in a tightening cycle. Really? Do investors even recognize that the Fed projected far greater economic growth than has actually occurred in every single year since 2008? Knowing that, why would anyone have confidence in a Fed expectation of 2% inflation? There are perhaps three investment themes that make sense at this point in the late stage U.S. bull market. First, the entire globe is in the process of stimulating economic growth through conventional and/or unconventional measures. Why fight their central banks? As bond yields around the world continue moving lower, the activity only makes longer-term, dollar-denominated debt more attractive. If you want to buy the proverbial dips, you should probably be buying the bond dips on relative value . Consider the iShares 10-20 Year Treasury Bond ETF (NYSEARCA: TLH ), the Vanguard Long-Term Bond ETF (NYSEARCA: BLV ) and closed-end muni fund like the Nuveen Municipal Opportunity Fund (NYSE: NIO ). The second theme involves buying stimulus-driven stock ETFs. The WisdomTree India Earnings ETF (NYSEARCA: EPI ) has been a tremendous beneficiary of its own country’s unexpected rate cut activity, while the iShares Currency Hedged MSCI Germany ETF (NYSEARCA: HEWG ) should benefit from the markedly lower euro and the negligible German bund yields that push investors into German equities. Third, investors should continue to hold prominent U.S. equity ETFs for as long as they are still working for them. I still maintain an allegiance to the Health Care Select Sect SPDR ETF (NYSEARCA: XLV ), the iShares MSCI USA Minimum Volatility ETF (NYSEARCA: USMV ) as well as the Vanguard High Dividend Yield ETF (NYSEARCA: VYM ). If any of these positions break below a 200-day moving average, however, I would insure against further depreciation by selling the position or increasing exposure to the index that my colleague and I created, the FTSE Custom Mutli-Asset Stock Hedge Index . One can already see the benefits of multi-asset stock hedging over 1 months, 3 months, 6 months and 1 year, where the combination of certain currencies, commodities, foreign sovereign debt and U.S. bonds are achieving desirable results. Disclosure: Gary Gordon, MS, CFP is the president of Pacific Park Financial, Inc., a Registered Investment Adviser with the SEC. Gary Gordon, Pacific Park Financial, Inc, and/or its clients may hold positions in the ETFs, mutual funds, and/or any investment asset mentioned above. The commentary does not constitute individualized investment advice. The opinions offered herein are not personalized recommendations to buy, sell or hold securities. At times, issuers of exchange-traded products compensate Pacific Park Financial, Inc. or its subsidiaries for advertising at the ETF Expert web site. ETF Expert content is created independently of any advertising relationships.

VNQ: A REIT ETF Worthy Of My Portfolio

Summary VNQ offers investors the full package of benefits I’m looking for. The ETF is offering excellent correlation benefits to SPY, low expense ratios, and great liquidity. REIT ETF’s generally offer very strong dividend yields. I’m not seeing any reason not to use VNQ. Investors should be seeking to improve their risk adjusted returns. I’m a big fan of using ETFs to achieve the risk adjusted returns relative to the portfolios that a normal investor can generate for themselves after trading costs. I’m working on building a new portfolio and I’m going to be analyzing several of the ETFs that I am considering for my personal portfolio. One of the funds that I’m considering is the Vanguard REIT Index Fund ETF (NYSEARCA: VNQ ). I’ll be performing a substantial portion of my analysis along the lines of modern portfolio theory, so my goal is to find ways to minimize costs while achieving diversification to reduce my risk level. What does VNQ do? VNQ attempts to track the total return (before fees and expenses) of the MSCI U.S. REIT Index. Substantially all of the assets are invested in funds included in this index. VNQ falls under the category of “Real Estate”. Does VNQ provide diversification benefits to a portfolio? Each investor may hold a different portfolio, but I use the SPDR S&P 500 Trust ETF (NYSEARCA: SPY ) as the basis for my analysis. I believe SPY, or another large cap U.S. fund with similar properties, represents the reasonable first step for many investors designing an ETF portfolio. Therefore, I start my diversification analysis by seeing how it works with SPY. I start with an ANOVA table: (click to enlarge) The correlation is just under 66%. That’s a very solid level of correlation and not unusual for comparing a REIT index to SPY. As an investor using modern portfolio theory, I’m happy with seeing that level of correlation. Of course, the value low correlation wouldn’t mean much if the values were being distorted by poor liquidity. The average volume of nearly 5 million shares per day suggests that liquidity shouldn’t be a concern. That’s a good sign for investors wanting verification of the statistics or wanting to know that they can exit the position with less concern about it deviating from NAV. Standard deviation of daily returns (dividend adjusted, measured since November 2013) The standard deviation is fairly reasonable. For VNQ it is .843%. For SPY, it is 0.736% for the same period. The ETF is definitely showing more volatility than SPY by a noticeable margin when we compare returns on a daily basis. Given the low correlation, it should still improve the risk profile of the portfolio. Mixing it with SPY I run comparisons on the standard deviation of daily returns for the portfolio assuming that the portfolio is combined with the S&P 500. For research, I assume daily rebalancing because it dramatically simplifies the math. With a 50/50 weighting in a portfolio holding only SPY and VNQ, the standard deviation of daily returns across the entire portfolio is 0.719%. With 80% in SPY and 20% in VNQ, the standard deviation of the portfolio would have been .711%. If an investor wanted to use VNQ as a supplement to their portfolio, the standard deviation across the portfolio with 95% in SPY and 5% in VNQ would have been .727%. In each scenario, the overall portfolio has less volatility than SPY. I am leaning towards running REITs in my portfolio as 10 to 20% of the total portfolio. Why I use standard deviation of daily returns I don’t believe historical returns have predictive power for future returns, but I do believe historical values for standard deviations of returns relative to other ETFs have some predictive power on future risks and correlations. Yield & Taxes The distribution yield is 3.60%. I like to see strong yields for retiring portfolios because I don’t want to touch the principal. By investing in ETFs I’m removing some of the human emotions, such as panic. Higher yields imply lower growth rates (without reinvestment) over the long term, but that is an acceptable trade off in my opinion. The ETF is composed of REITs, so investors concerned about the taxation impacts of investing in a REIT ETF should seek tax advice from a qualified professional. Expense Ratio The ETF is posting an expense ratio of .10%. I want diversification, I want stability, and I don’t want to pay for them. An expense ratio of .10% is absolutely beautiful and extremely attractive for an ETF that is also offering low correlation to SPY, strong yields, and great liquidity. Market to NAV The ETF is at a .05% discount to NAV currently. Premiums or discounts to NAV can change very quickly so investors should check prior to putting in an order. Generally speaking, that discount to NAV isn’t big enough to be a big deal. However, even a small discount to NAV is fairly attractive when we are talking about a high quality ETF. In my opinion, this is easily one of the most attractive ETFs I have examined. Largest Holdings The diversification in the holdings isn’t going to be a strong selling point. Nothing against Simon Property Group (NYSE: SPG ), but over 8% in the position is pretty big. Given that the expense ratio is .10%, I think that offsets the relatively mediocre level of diversification within the positions. The other individual companies that are making up the top several sections all have different exposures, such as self-storage, multi-family housing, and health care. (click to enlarge) Conclusion The combination of correlation, liquidity, and yield makes a great investment for investors that want to reduce the overall volatility of their portfolio without having their capital tied up in investments that can be difficult to exit. For investors looking at the very long term picture, the extremely low expense ratio is beautiful. Vanguard and Schwab have provided some ETFs with very low expense ratios. I don’t think an ETF should be chosen purely for the expense ratio, but I do believe investors should be very aware of it. When I’m putting together hypothetical portfolio positions, one of the things I include is the expense ratio of the ETFs to track the overall expense ratio on the portfolio. In trying to find anything wrong with the ETF, the biggest weaknesses would probably be the size of the position in SPG and the fact that it is market weighted. However, most ETFs are market weighted. Most ETFs also have enough weaknesses that I can easily spot at least something wrong. In the case of VNQ, the market cap issue is offset by the fund having a turnover ratio of only 11%. I’ve had a preference for Schwab funds because I have an account that can trade them for free. However, I also have some significant tax exempt accounts with other brokerages. I’m strongly considering VNQ for a position in my IRA. Got a different opinion? An argument for why I shouldn’t invest in VNQ? Let’s hear it in the comments. Additional disclosure: Information in this article represents the opinion of the analyst. All statements are represented as opinions, rather than facts, and should not be construed as advice to buy or sell a security. Ratings of “outperform” and “underperform” reflect the analyst’s estimation of a divergence between the market value for a security and the price that would be appropriate given the potential for risks and returns relative to other securities. The analyst does not know your particular objectives for returns or constraints upon investing. All investors are encouraged to do their own research before making any investment decision. Information is regularly obtained from Yahoo Finance, Google Finance, and SEC Database. If Yahoo, Google, or the SEC database contained faulty or old information it could be incorporated into my analysis. The analyst holds a diversified portfolio including mutual funds or index funds which may include a small long exposure to the stock.

ALPS Plans A Put Write ETF To Play Market Volatility

The U.S. markets have seen a volatile start to the year, thanks to the relentless slide in crude oil prices, worries about a possible exit of Greece from the Euro zone, global economic growth concerns and slumping commodity prices. Rising market volatility has led some issuers to plan for funds based on put write strategy. WisdomTree has lately filed for a fund – WisdomTree CBOE S&P 500 Put Write Strategy Fund – to generate returns by writing put options on the S&P index. Most recently, ALPS has filed for a fund based on a similar strategy. The proposed fund will go under the name of ALPS Enhanced Put Write Strategy ETF (Pending: PUTX ). Below, we have highlighted some of the key details of the recently filed fund. PUTX in Focus As per the SEC filing , the proposed actively managed product looks to maximize total return by selling put options on the SPDR S&P 500 Trust ETF (NYSEARCA: SPY ). SPY tracks the S&P 500 index measuring the performance of large-cap U.S. stocks. The premium received will then be invested in an actively managed portfolio of investment grade debt securities. The portfolio will include Treasury bills, corporate bonds, commercial paper and mortgage- and asset-backed securities, having an average duration of less than 6 months and maturity of less than one year. How might it fit in a portfolio? The fund is a good choice for investors who wish to add income and thereby boost risk-adjusted returns. Investors who believe that the U.S. equity market will trade in a narrow range next year can look to invest in the fund. A put write strategy usually outperforms the index in a down trending market and significantly outperforms the S&P 500 index in a sideways market. Moreover, put write strategies have historically outperformed buy strategies. However, investors should keep in mind that the fund’s potential return is limited to the amount of option premium it receives and that the proposed fund might underperform during strong bull markets. ETF Competition The recently filed product is quite similar in strategy to the WisdomTree CBOE S&P 500 Put Write Strategy Fund. However, unlike PUTX. which sells options on SPY ETF, WisdomTree’s product looks to sell options on the S&P 500 index itself. Moreover, while PUTX looks to invest the premium received in an actively managed portfolio of investment grade debt securities with less than one year maturity, the CBOE S&P 500 Put Write Strategy Fund will invest the premium received in one-to-three month U.S. Treasury securities. As such, both the funds might be good competitors if launched. Apart from this we also have another put-write fund in the market from ALPS itself. The fund in question – US Equity High Volatility Put Write Index ETF (NYSEARCA: HVPW ) – tracks the NYSE Arca U.S. Equity High Volatility Put Write Index. The index sells put options on the largest capitalized stocks having the highest volatility. The index uses the sales proceeds to invest in short-term U.S. Treasury securities. The fund manages an asset base of $50.8 million and trades in low volumes of roughly 23,000 shares a day. The ETF charges 95 basis points as fees and has delivered flat returns in the year-to-date frame. So, there is hardly any competition for the newly proposed fund. If launched, the fund has a fair chance of making a name for itself. However, let’s not forget that success over the longer run is ultimately a huge factor of the fund’s performance.