Tag Archives: handle

ETF Deathwatch For January 2015: The Year Begins At 322

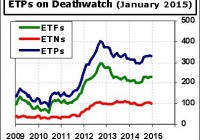
ETF Deathwatch begins 2015 with 322 products on the list, consisting of 222 ETFs and 100 ETNs. Fourteen names joined the lineup this month and nineteen exited. Just nine came off due to improved health, while the other ten met their death and no longer exist. Despite the closure of about 450 ETFs and ETNs over the past decade, there are still 322 zombie products remaining, and they average just $6.4 million in assets. The average age of these products is 47 months, more than enough time to attract a little investor interest. Clearly, these products are neither desired by investors nor profitable for their sponsors, making one tend to wonder why they still exist. The fourteen new names on the list this month include a dozen based on MSCI indexes, nine ‘quality’ ETFs from State Street SPDRs, and two ‘low volatility’ products from BlackRock iShares. There are dozens of successful products tracking MSCI indexes, carrying SPDR and iShares brands, and pursuing factor-based strategies, yet these new additions are struggling. The recipe for success obviously requires more than just having the right ingredients. Thirty-six brand names appear on ETF Deathwatch, and two of these brands have their entire product line on the list. All five Columbia ETFs are included. These actively managed funds have been on the market about five years, yet none have gathered more than $10 million in assets. QuantShares is the sponsor of four ETFs, all more than three years old, all with less than $4 million in assets, and all on ETF Deathwatch. It’s now 2015, which means a second calendar year has come and gone without the iPath Short Enhanced MSCI Emerging Markets Index ETN (NYSEARCA: EMSA ) registering a single trade. November 9, 2012 was the last time EMSA saw any action, and there were only 100 shares traded that day. It was just one of eight products going the entire month of December without a transaction. Additionally, 145 products failed to register any volume on the last day of the year. Here is the Complete List of 322 Products on ETF Deathwatch for January 2015 compiled using the objective ETF Deathwatch Criteria . The 14 ETPs added to ETF Deathwatch for January: First Trust ISE Global Platinum (NASDAQ: PLTM ) iPath Bloomberg Industrial Metals ETN (NYSEARCA: JJM ) iShares MSCI Asia ex Japan Minimum Volatility (NYSEARCA: AXJV ) iShares MSCI Emerging Markets Consumer Discretionary (NASDAQ: EMDI ) iShares MSCI Europe Minimum Volatility (NYSEARCA: EUMV ) SPDR MSCI Australia Quality Mix (NYSEARCA: QAUS ) SPDR MSCI Canada Quality Mix (NYSEARCA: QCAN ) SPDR MSCI EAFE Quality Mix (NYSEARCA: QEFA ) SPDR MSCI Emerging Markets Quality Mix (NYSEARCA: QEMM ) SPDR MSCI Germany Quality Mix (NYSEARCA: QDEU ) SPDR MSCI Japan Quality Mix (NYSEARCA: QJPN ) SPDR MSCI Spain Quality Mix (NYSEARCA: QESP ) SPDR MSCI United Kingdom Quality Mix (NYSEARCA: QGBR ) SPDR MSCI World Quality Mix (NYSEARCA: QWLD ) The 9 ETPs removed from ETF Deathwatch due to improved health: First Trust Developed Markets x-US Small Cap AlphaDEX (NYSEARCA: FDTS ) First Trust Managed Municipal (NASDAQ: FMB ) Global X Junior MLP ETF (NYSEARCA: MLPJ ) iPath Pure Beta Broad Commodity ETN (NYSEARCA: BCM ) iShares Currency Hedged MSCI EAFE ETF (NYSEARCA: HEFA ) PowerShares DB Crude Oil Short ETN (NYSEARCA: SZO ) ProShares Global Listed Private Equity (BATS: PEX ) RevenueShares ADR (NYSEARCA: RTR ) Teucrium Soybean (NYSEARCA: SOYB ) The 10 ETPs removed from ETF Deathwatch due to delisting: Market Vectors Bank and Brokerage (NYSEARCA: RKH ) Market Vectors Colombia (NYSEARCA: COLX ) Market Vectors Germany Small-Cap (NYSEARCA: GERJ ) Market Vectors Latin America Small-Cap (NYSEARCA: LATM ) Market Vectors Renminbi Bond (NYSEARCA: CHLC ) Teucrium Natural Gas (NYSEARCA: NAGS ) Teucrium WTI Crude Oil (NYSEARCA: CRUD ) EGShares Emerging Markets Dividend Growth (NYSEARCA: EMDG ) EGShares Emerging Markets Dividend High Income (NYSEARCA: EMHD ) Direxion Daily Gold Bear 3x Shares (NYSEARCA: BARS ) ETF Deathwatch Archives Disclosure covering writer, editor, and publisher: No positions in any of the securities mentioned . No positions in any of the companies or ETF sponsors mentioned. No income, revenue, or other compensation (either directly or indirectly) received from, or on behalf of, any of the companies or ETF sponsors mentioned.

How Does VXX’s Daily Roll Work?

All volatility Exchange Traded Products (ETPs) use indexes that track a mix of two or more months of the CBOE’s VIX Futures. Calculating this mix is not trivial and has resulted in a lot of bleary eyes – including my own. My intent with this post is to help you understand, and if you desire, accurately compute the key indexes used in the iPath S&P 500 VIX Short-Term Futures ETN (NYSEARCA: VXX ) and other short-term volatility funds using Excel or similar tools. Why do we need a roll anyway? If we could directly buy the CBOE’s VIX index none of this would be necessary. Unfortunately, no one has figured out a cost effective approach so we are forced to use the next best thing – VIX Futures. Like options, VIX futures have fixed expiration dates so volatility indexes need a process of rotating their inventory of futures in order to have consistent exposure to volatility. This rotation process is evident in the open interest chart below – the next to expire futures being closed out and the next month of futures being opened. Indexes and Funds are different things Before we dive into the details of how this rotation is dealt with, I’d like to address one source of confusion. ETPs are not obligated to follow the approach detailed in the indexes. They are allowed to use other approaches (e.g., over-the-counter swaps) in their efforts to track their indexes. When ETPs are working properly, their prices closely track the index they specify in their prospectus minus their fees that are deducted on a daily basis. Because indexes are theoretical constructs they can ignore some practical realities. For example, they implicitly assume fractional VIX futures contracts exist and that the next day’s position can be put in place at market close – even though calculating that position requires market close information. I’m sure these issues cause headaches for the fund managers, but to their credit the funds usually closely track their index. The Index Calculation The details for the index (ticker SPVXSTR ) that VXX tracks are detailed in VXX’s prospectus , pages PS-21 through PS-22. The math is general enough that it covers both the short term index that VXX uses and the midterm index VXZ uses – which adds to its complexity. The equations use Sigma (?) notation, which probably makes it challenging for people that haven’t studied college level mathematics. I will present the math below using high school level algebra. Except for interest calculations all references to days are trading days, excluding market holidays and weekends. The volatility indexes used by short-term volatility ETPs ( list of all USA volatility ETPs ) utilize the same roll algorithm – at the end of each trading day they systematically reduce the portion of the overall portfolio allocated to the nearest to expiration contracts (which I call M1) and increase the number of the next month’s contracts (M2). The mix percentages are set by the number of trading days remaining on the M1 contract and the total number of days it’s the next to expire contract (varies between 16 and 25 days). So if there are 10 days before expiration of the M1 contract out of a total of 21 the mix ratio for M1 will be 10/21 and 11/21 for M2. At close on the Tuesday before the Wednesday morning M1 expiration there’s no mix because 100% of the portfolio is invested in M2 contracts. It’s important to understand that the mix is managed as a portfolio dollar value, not by the number of futures contracts. For example, assume the value at market close of a VIX futures portfolio was $2,020,000, and it was composed of 75 M1 contracts valued at 12 and 80 M2 contracts at 14 (VIX futures contracts have a notional value of $1K times the trading value). To shift that portfolio to a 9/21 mix for M1 and 12/21 for M2 you should take the entire value of the portfolio and multiply it by 9/21 to get the new dollar allocation for M1, $865,714 (72.14 contracts) and 12/21 times the entire portfolio value to get the dollar allocation for M2, $1,154,286 (82.45 contracts). Value weighting gives the index a consistent volatility horizon (e.g., 30 calendar days) – otherwise higher valued futures would be disproportionately weighted. The next section is for people that want to compute the index themselves. Yes, there are people that do that. If you are interested in the supposed “buy high, sell low” theory of roll loss you should check out the “Contango Losses” topic at the bottom of this post. The Variables Lower case “t” stands for the current trading day, “t-1” stands for the previous trading day. The index level for today (IndexTR t ) is equal to yesterday’s index (IndexTR t-1 ) multiplied by a one plus a complex ratio plus the Treasury Bill Return TBR t. The index creators arbitrarily set the starting value of the index to be 100,000 on December 20th, 2005. The number of trading days remaining on the M1 contract is designated by “dr” and the total number of trading days on the M1 contract is “dt.” M1 and M2 are the daily mark-to market settlement values, not the close values of the VIX futures. The CBOE provides historical data on VIX futures back to 2004 here . The Equations When dr is not equal to dt: When dr = dt (the day the previous M1 expires): Yes, this equation could be simplified, but then it wouldn’t fit as nicely into the equation below which uses a little logic to combine both cases: The equation assumes that the entire index value is invested in treasury bills. Contango Losses An interesting special case occurs when you assume that the M1 and M2 prices are completely stable and in a contango term structure for multiple days-for example, M1 at 17 and M2 at 18. In that situation the equation simplifies to: This special case illustrates that there is no erosion of the index value just because it’s selling lower price futures and buying higher priced futures-in fact it goes up because of T-bill interest. It’s the equivalent of exchanging two nickels for a dime-no money is lost. For more on this see: The Cost of Contango-It’s Not the Daily Roll . Disclosure: None

Finally A New Airline ETF Prepares To Take Off

The U.S. aviation industry has been on cloud nine since the oil price succumbed to gravity. Moreover, a pickup in the domestic economy, rising cargo demand, a boost to tourism and the subsiding Ebola scare put the industry in the top-performing category. The sentiment around the sector was so bullish that Airlines rocketed to the highest level since 2001 in late December, per Bloomberg . Investors should note that the ETF industry was largely unable to reap the return out of this booming industry as Guggenheim closed the last airline ETF Guggenheim Arca Airline ETF (NYSEARCA: FAA ) in 2013. Prior to that, Direxion Airline Shares ETF (NYSE: FLYX ) had also faced the same fate in 2011. However, to fill the void, a new airline ETF has been filed lately. The fund looks to trade under the name of U.S. Global Jets ETF (JETS) . The Proposed Fund in Detail The passively managed product intends to track the U.S. global Jets Index that considers worldwide airline companies, per the prospectus. The index attaches weight to the companies on the basis of the square root of their average daily volume seen in the trailing three months. The index looks to consider 25 to 40 airline stocks across the market. The product will charge 60 bps in fees. How Does it Fit in a Portfolio? The global aviation industry holds a steady outlook for 2015. The outlook is especially positive for the U.S. economy, with GDP growth gaining momentum. Consolidation benefits, growing travel demand and enhanced ancillary revenues also provide an impetus for growth. Other regions including the Middle East, Latin America & Africa and Asia-Pacific also hold promise. Several Gulf-based airlines continue to build up their positions within the global airline industry. Fleet development should improve over the coming years. Apart from the high demand from the oil rich Gulf nations, a major part of the fleet demand will be driven by China and India, and continuous expansion of low budget carriers around the world. If this was not enough, an unexpected plunge in oil prices turned out to be the real catalyst in propelling the industry. Airline profit outlook depends on fuel prices, the major variable component in the industry. The oil price drop of about 50% seen in 2014 is yet to turn around in 2015. In such a bullish backdrop, the upcoming airline ETF has every reason to be successful, if it gets approval. ETF Competition The road ahead for the proposed ETF is nothing but clear skies. The industry has long been waiting for such a product after the shutdown of the Guggenheim fund. While there are no direct competitors to the product, investors should note that two transportation ETFs, namely the iShares Transportation Average ETF (NYSEARCA: IYT ) and the SPDR S&P Transportation ETF (NYSEARCA: XTN ) have weight in the airlines industry. While IYT puts about 45% of its weight in the airlines, air freight & logistics sectors, XTN places about one-fourth of the fund in them. We expect the newly filed product to cash in on the underlying sector’s allure and find a solid following among investors. Nonetheless, the two transportation ETFs could eat into the proposed fund’s asset base because of the formers’ diversified approach to the transportation sector. Still, investors solely eyeing the global aviation industry would be satisfied by the proposed JETS ETF.