Tag Archives: handle

How Do Fidelity’s New Bond Exchange-Traded Funds Stack Up?

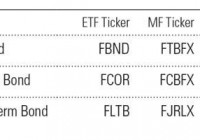
A version of this article was published in the November 2014 issue of Morningstar ETFInvesto r. Download a complimentary copy of ETFInvestor here . On Oct. 9, Fidelity launched three active-bond exchange-traded funds: Fidelity Total Bond (NYSEARCA: FBND ) , Fidelity Corporate Bond (NYSEARCA: FCOR ) , and Fidelity Limited Term Bond (NYSEARCA: FLTB ) . The table below shows the lead managers of each fund as well as their mutual fund analogs. All six funds charge 0.45%. Fidelity follows PIMCO in launching active-bond ETFs, inviting comparison between the two. Are these new funds better than existing PIMCO ETFs? Or passive funds? Fidelity Versus PIMCO Fidelity is more known for its equity funds, but Morningstar analyst Sarah Bush writes that its bond team is “among the industry’s best.” PIMCO is synonymous with fixed income, and analyst Eric Jacobson writes that the firm “[boasts] world-class practitioners and intellects across the board.” So investors have two good options. One big difference between the firms is that PIMCO makes big macroeconomic calls, whereas Fidelity’s bond funds won’t. Most Fidelity bond funds keep their durations close to their benchmarks and focus on making security- and sector-level credit bets. As a consequence, some of Fidelity’s bond funds failed to sidestep the subprime crisis and the financial crisis and suffered sharp losses relative to their benchmarks. PIMCO’s funds, however, sailed through relatively unscathed, having avoided subprime exposure. On the other hand, PIMCO suffered sharp losses in 2011 when it incorrectly bet against Treasuries; Fidelity’s bond funds made no such dramatic calls. Historically, PIMCO’s extensive use of factor timing meant that its fund’s patterns of excess returns relative to their benchmarks were less predictable than Fidelity’s bond funds, which tend to do well when credit does well. Fidelity Total Bond Ford O’Neil is lead manager of both FBND and its mutual fund counterpart, Fidelity Total Bond (MUTF: FTBFX ) . Naturally, the ETF itself can’t be assessed with confidence, but we can make reasonable inferences about its prospective behavior by looking at the mutual fund version of the strategy. O’Neil has spent almost 10 years running the mutual fund, so we have a lot of data to work with. Here’s how Bush describes Fidelity Total Bond’s process: This wide-ranging fund has a variety of tools at its disposal. As at other Fidelity bond funds, duration (a measure of interest-rate sensitivity) is kept close to that of the fund’s bogy, the Barclays U.S. Aggregate Bond Index. Instead, manager O’Neil seeks to beat this benchmark over a three-year period by identifying relatively underpriced sectors of the market and segments of the yield curve, and through individual security selection. This is primarily an investment-grade portfolio–think high-quality corporate bonds, agency mortgages, and Treasuries–livened up with a mix of junk bonds, floating-rate bank loans, and developed- and emerging-markets debt. The fund gets its bank-loan and mortgage exposure from internally run Fidelity “central” funds run by other managers; bank loans are relatively illiquid, so the central-fund approach helps control cash flows, while O’Neil argues that there are significant advantages of scale in the mortgage portfolios. Since O’Neil took over, the fund beat its benchmark by 0.48% annualized as of Sept. 30, 2014. Of course, you can’t own the index. When compared against Vanguard Total Bond Market Index (MUTF: VBMFX ) , O’Neil looks a bit better, extending his edge to 0.61% annualized. However, we care about returns in excess of risk taken. The next chart shows Fidelity Total Bond’s cumulative wealth ratio versus Vanguard Total Bond Market Index. When the line slopes up, Fidelity’s fund is outperforming the Vanguard fund; when it slopes down, it’s underperforming. Total Bond did outperform over O’Neil’s tenure, but at the cost of a nasty drawdown that showed up during the financial crisis. We can get a fuller picture of O’Neil’s record by examining his tenure at Fidelity Intermediate Bond (MUTF: FTHRX ) , which covered July 13, 1998, to Oct. 29, 2013. It is the oldest and longest U.S. bond fund track record of his that we have. The second chart shows cumulative wealth of the fund against its benchmark, the Barclays Intermediate U.S. Government/Credit Index. We see benchmark-matching performance punctuated by a nasty drawdown during the financial crisis. What accounted for these drawdowns? First, O’Neil kept a slug of his fund in an internally managed ultrashort bond portfolio that had substantial exposure to subprime mortgages, which led to the fund’s lagging in late 2007. Second, the fund also had a junk-bond sleeve going into the crisis, but the index excludes them. Despite O’Neil’s mixed record versus his benchmarks, Fidelity Total Bond outpaced most of his category peers, landing in the top 22% for the 10 years ended Sept. 30. The Fidelity Total Bond mutual fund has a Morningstar Analyst Rating of Gold, which indicates Morningstar believes the fund will beat its category peers on a risk-adjusted basis over a full market cycle. There is only one other actively managed ETF of note benchmarked against the Aggregate Index: PIMCO Total Return Active (NYSEARCA: BOND ) , which serves as my default broad bond exposure. The only sensible way to assess investments is through the lens of opportunity cost. Am I giving up space that could be devoted to a better fund if I stick with BOND? I’m about as confident as can be that BOND can beat its benchmark over a full interest-rate or credit cycle, without taking on much more risk. The next chart shows PIMCO Total Return’s cumulative wealth ratio versus the benchmark juxtaposed with Fidelity Total Bond’s cumulative wealth ratio. The different performance patterns reveal the distinct processes driving each fund. PIMCO Total Return is willing to make big macro calls–market-time, in other words–hence its sidestepping much of the carnage of the financial crisis, riding the mortgage-backed securities wave, then getting clobbered in 2011 on its big short Treasury bet. Fidelity Total Bond mostly makes security- and sector-level calls without varying its duration or taking too much risk off the table. The result is the fund that took a beating during the crisis but has steadily earned excess returns as credit exposure has done well. Fidelity Corporate Bond Michael Plage and David Prothro comanage this fund. Although Plage is lead manager of FCOR, Prothro is lead of the mutual fund Fidelity Corporate Bond (MUTF: FCBFX ) . Neither Plage nor Prothro have O’Neil’s long track record. Plage joined Fidelity in 2005 as a fixed-income trader before switching to a portfolio-management role in 2010. Prothro has been with Fidelity as a fixed-income analyst since 1991, but his oldest pure U.S. bond mandate also begins in 2010. Plage and Prothro have done very well with Fidelity Corporate Bond. They’ve beaten their benchmark, the Barclays U.S. Credit Index, by more than 1%. So far it seems as if Plage and Prothro have what it takes. But we haven’t gone through a full credit cycle, so I’m not willing to assign a high degree of confidence that their fund will outperform. There is no other actively managed bond ETF also benchmarked to a similar index or in the corporate-bond category. Fidelity Limited Term Bond FLTB, led by Robert Galusza, begs natural comparisons with the mutual fund Fidelity Limited Term Bond (MUTF: FJRLX ) , also managed by Galusza. The mutual fund’s track record is utterly misleading. A closer look reveals that Fidelity Limited Term Bond until very recently was the Fidelity Advisor Intermediate Bond Fund, which was benchmarked to the Barclays U.S. Intermediate Government/Credit Bond Index. Its lead manager was also O’Neil, who began managing the fund the same day he took over Fidelity Total Bond and ended his tenure on Oct. 29, 2013. Now we have another angle to assess Fidelity Total Bond. Unfortunately, during O’Neil’s tenure, Fidelity Advisor Intermediate Bond underperformed its benchmark with much more volatility. A more relevant mutual fund equivalent for Fidelity Limited Term Bond is Fidelity Short-Term Bond (MUTF: FSBFX ) , which Galusza joined on July 12, 2007. However, Andrew Dudley managed the fund until Feb. 21, 2008. In order to give Galusza the benefit the doubt, I’ll assess his performance the month after Dudley left. The chart shows how he did against the fund’s benchmark, the Barclays U.S. 1-3 Year Government/Credit Bond Index. Like Fidelity Total Bond, Fidelity Short-Term Bond took a big hit during the financial crisis due to its subprime mortgage exposure. Of all three funds, this one is the least appealing from a historical risk/return perspective. It’s also going up against extremely stiff competition in the form of high-yield, low early withdrawal penalty five-year bank CDs that offer 2% yields as of this writing. No ETF offers anywhere near as favorable a risk/reward trade-off. I’ve been consistent in pointing out that low-duration funds are a bad deal, including the two other active ETFs benchmarked to the Barclays U.S. 1-3 Year Government/Credit Bond Index: AdvisorShares Newfleet Multi-Sector Income (NYSEARCA: MINC ) and PIMCO Low Duration Active (NYSEARCA: LDUR ) .
Taking ETF Trades To The Next Level

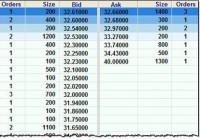
Experienced investors know the theory: ETFs are supposed to trade very close to their net asset value (NAV). And most of the time they do. But this week my PWL Capital colleague Justin Bender and I encountered a glaring exception that could have had expensive consequences. On Monday, Justin and I wanted to sell the iShares U.S. Dividend Growers Index ETF (CUD) in a client’s account. It was a large trade: more than 5,000 shares, which worked out to over $160,000. As we always do before making such a trade, we got a Level 2 quote, which reveals the entire order book. In other words, it tells you how many shares are being offered on the exchange for purchase or sale at various prices. By contrast, a Level 1 quote-the type normally available through discount brokerages-only tells you how many shares are available at the best bid and ask prices. If an ETF’s market maker is doing its job, there should be thousands of shares available at the best price. But we were surprised to find the Level 2 quote looked like this: Source: Thomson ONE Let’s unpack this. As sellers, we looked at the “Bid” column, and the best price (at the top of the column) was $32.61. But we’d be able to sell a mere 200 shares at that price, as revealed in the “Size” column to the left. We could unload another 400 for just a penny less, but after that the prices plummeted. Had we placed a limit order to sell 5,000 shares for $32.60 (one cent below the best bid price), we likely would have seen only 600 shares get sold. But that would have been a minor inconvenience compared to what might have happened if we’d placed a market order. Remember, a market order does not specify a minimum price you’ll accept when selling: it simply tells the exchange you will take whatever is being offered. Assuming a market order for 5,000 shares would have been filled according to the prices above, we would have received as little as $31.65 on the last few hundred shares-almost a full dollar lower than the best bid price. The average price for that market order would have been just $32.23, netting us proceeds of $161,150. Had we been able to sell all 5,000 shares at the best bid price-which is what we’d normally expect-we would have received almost $2,000 more . As you can imagine, we did not place this trade for our client. When market makers take a holiday This lack of depth in an ETF’s order book is very unusual. Even if an ETF is not frequently traded , market makers ensure that thousands of shares are available for purchase or sale at a price very close to NAV. So what was the reason for this anomaly? We can’t be sure, but Justin suspected it was because U.S. markets were closed on Monday (it was Martin Luther King, Jr. Day) while the TSX remained open. CUD is a Canadian-listed ETF, but its underlying holdings are U.S. stocks that were not trading that day: this would have made it more difficult for the market makers to determine the NAV of the fund. Indeed, the lot sizes were so small it’s unlikely they were posted by market makers at all: they may simply have been from individual investors. To test that idea, we got a Level 2 quote for another Canadian ETF that holds U.S. stocks: the Vanguard U.S. Total Market (VUN) . Sure enough, this one showed little market depth as well. Had you tried to sell more than 400 shares (or buy more than about 1,300) you may have seen your order filled at a surprising price. I checked the Level 2 orders for both ETFs again on Tuesday and the situation was completely different. Both funds had 20,000 to 30,000 shares available within a penny of the best bid and ask prices. Lessons learned This was a big trade that most retail investors would never make. But there important lessons from our little adventure that apply to anyone who uses ETFs. First, it’s the most dramatic example I’ve seen for why you should never use market orders . In this situation, a market order would have got you into trouble had you tried to trade as little as $20,000. On a very large trade like ours, it might have been a disaster. Second, avoid trading foreign equity ETFs when the underlying markets are closed. There are several American holidays when the Canadian market remains open, and these are not the days to be making large trades in ETFs that hold U.S. stocks. If you’re making a significant trade in an international equity ETF, it’s also a good idea to pay attention to time zone differences . Finally, if you have a large portfolio, consider subscribing to a service that provides Level 2 quotes. Check with your brokerage to see what is available, because practices vary a lot. Scotia iTRADE provides these free upon request, for example, while RBC Direct Investing and TD Direct Investing offer them as part of their Active Trader programs, and others such as Questrade charge a fee.

Ghost In The Machine, Part 1

The way out is through the door. Why is it that no one will use this method? ― Confucius (551 – 479 BC) Tanzan and Ekido were once traveling together down a muddy road. A heavy rain was still falling. Coming around a bend, they met a lovely girl in a silk kimono and sash, unable to cross the intersection. “Come on, girl,” said Tanzan at once. Lifting her in his arms, he carried her over the mud. Ekido did not speak again until that night when they reached a lodging temple. Then he could no longer restrain himself. “We monks don’t go near females,” he told Tanzan, “especially not young and lovely ones. It is dangerous. Why did you do that?” “I left the girl there,” said Tanzan. “Are you still carrying her?” ― Nyogen Senzaki, “Zen Flesh, Zen Bones: A Collection of Zen and Pre-Zen Writings” (1957) In 1995, David Justice had a superior batting average to Derek Jeter (.253 to .250) In 1996, David Justice had a superior batting average to Derek Jeter (.321 to .314) In 1997, David Justice had a superior batting average to Derek Jeter (.329 to .291) Yet from 1995 – 1997, Derek Jeter had a superior batting average to David Justice (.300 to .298) ― example of Simpson’s Paradox, aka The Yule-Simpson Effect (1951) A student says, “Master, please hand me the knife,” and he hands the student the knife, blade first. “Please give me the other end,” the student says. And the master replies, “What would you do with the other end?” ― Alan W. Watts, “What Is Zen?” (2000) Such in outline is the official theory. I shall often speak of it, with deliberate abusiveness, as “the dogma of the Ghost in the Machine.” I hope to prove that it is entirely false, and false not in detail but in principle. It is not merely an assemblage of particular mistakes. It is one big mistake and a mistake of a special kind. It is, namely, a category mistake. ― Gilbert Ryle (1900 – 1976) The trouble with Oakland is that when you get there, there isn’t any there there. ― Gertrude Stein (1874 – 1946) Dr. Malcolm: Yeah, yeah, but your scientists were so preoccupied with whether or not they could that they didn’t stop to think if they should . ― “Jurassic Park” (1993) It’s a big enough umbrella But it’s always me that ends up getting wet. ― The Police, “Every Little Thing She Does is Magic” (1981) Everyone who lost money on the SNB’s decision to reverse course on their three and a half year policy to cap the exchange rate between the CHF and the Euro made a category error . And by everyone I mean everyone from Mrs. Watanabe trading forex from her living room in Tokyo to a CTA portfolio manager sitting in front of 6 Bloomberg monitors to a financial advisor answering a call from an angry client. It will take me a bit of verbiage to explain what I mean by a category error and why it’s such a powerful concept in logic and portfolio construction. But I think you’ll find it useful, not just for understanding what happened, but also (and more importantly) to protect yourself from it happening again. Because this won’t be the last time the markets will be buffeted by a forex storm here in the Golden Age of the Central Banker. A year and a half ago, when I was just starting Epsilon Theory, I wrote a note called ” The Tao of Portfolio Management .” It’s one of my less-downloaded notes, I think largely because its subject matter – problems of misunderstood logic and causality in portfolio construction – doesn’t exactly have the sexiness of a rant against Central Bank Narrative dominance, but it’s one of my personal favorites. That note was all about the ecological fallacy – a pervasive (but wrong-headed) human tendency to infer qualities about the individual from qualities of the group, and vice versa. Today I’ve got the chance to write once again about the logic of portfolio construction AND work in some of my favorite Zen quotes AND manage something of a Central Bank screed … a banner day! I’ve titled this note “The Ghost in the Machine” because it starts with another pervasive (but wrong-headed) human tendency – the creation of a false dualism between mind and body. I know, I know … that sounds both really daunting and really boring, but bear with me. What I’m talking about is maybe the most important question of modern philosophy – is there a separate thing called “mind” or “consciousness” that humans possess, or is all of that just the artefact of a critical mass of neurons firing within our magnificent, but entirely physical, brains? I’m definitely in the “everything is explained by neurobiology” camp, which I’d say is probably the more widely accepted view (certainly the louder view) in academic philosophy today, but for most of the 19th and 20th centuries the dualist or Cartesian view was clearly dominant, and it was responsible for a vast edifice of thought, a beautiful cathedral of philosophical constructs that was … ultimately really disappointing and empty. It wasn’t until philosophers like Gilbert Ryle and Van Quine started questioning what Ryle called “the ghost in the machine” – this totally non-empirical but totally accepted belief that humans possessed some ghostly quality of mind that couldn’t be measured or observed but was responsible for driving the human machine – that the entire field of philosophy could be reconfigured and take a quantum leap forward by incorporating the insights of evolutionary biology, neurobiology, and linguistics. Unfortunately, most economists and investors still believe in ghosts, and we are a long way from taking that same quantum leap. There is an edifice of mind that dominates modern economic practice … a beautiful cathedral where everything can be symbolized, where everything can be securitized, and where everything can be traded. We have come to treat these constructed symbols as the driver of the economic machine rather than as an incomplete reflection of the real world things and real world activities and real world humans that actually comprise the economy. We treat our investment symbols and thoughts as a reified end in themselves, and ultimately this beautiful edifice of symbols becomes a maze that traps us as investors, just as mid-20th century philosophers found themselves trapped within their gorgeous constructs of mind. We are like Ekido in the Zen koan of the muddy road, unable to stop carrying the pretty girl in our thoughts and trapped by that mental structure, long after the far more sensible monk Tanzan has carried the girl safely over the real world mud without consequence, symbolic or otherwise. The answer to our overwrought edifice of mind is not complex. As Confucius wrote in The Analects , the door is right there in front of us. Exiting the maze and reducing uncompensated risk in our portfolios does not require an advanced degree in symbolic logic or some pretzel-like mathematical process. It requires only a ferocious commitment to call things by their proper names. That’s often not an easy task, of course, as the Missionaries of the Common Knowledge Game – politicians, central bankers, famous investors, famous economists, and famous journalists – are dead-set on giving things false names, knowing full well that we are hard-wired as social animals to respond in ant-like fashion to these communication pheromones. We are both evolved and trained to think in terms of symbols that often serve the purposes of others more than ourselves, to think of the handle rather than the blade when we ask for a knife. The meaning of a knife is the blade. The handle is not “the other end” of a knife; it is a separate thing with its own name and usefulness. The human animal conflates separate things constantly … maybe not a big deal in the kitchen, but a huge deal in our portfolios. Replace the word “knife” with “diversification” and you’ll get a sense of where I’m going with this. Here’s what I mean by calling things by their proper names. The stock ticker “AAPL” or the currency ticker “CHF” are obviously symbols. Less obviously but more importantly, so are the shares of Apple stock and the quantities of Swiss francs that AAPL and CHF represent. Stocks and bonds and commodity futures and currencies are symbols, not real things at all, and we should never forget that. The most common category error that investors make (and “category error” is just a $10 phrase for calling something by the wrong name) is confusing the symbol for what it represents, and as a result we forget the meaning of the real world thing that’s been symbolized. A share of stock in, say, Apple is a symbol. Of what? A limited liability fractional ownership position in the economic interests of Apple, particularly its free cash flows. A futures contract in, say, copper is a symbol. Of what? A commitment to receive or deliver some amount of real-world copper at some price at some point in the future. A bond issued by, say, Argentina is a symbol. Of what? A commitment by the Argentine government to repay some borrowed money over an agreed-upon period of time, plus interest. A currency issued by, say, Switzerland is a symbol. Of what? Well, that’s an interesting question. There’s no real world commitment or ownership that a currency symbolizes, at least not in the same way that stocks, bonds, and commodity contracts symbolize an economic commitment or ownership stake. A currency symbolizes government permission. It is a license. It is an exclusive license (which makes it a requirement!) to use that currency as a medium for facilitating economic transactions within the borders of the issuing government, with terms that the government can impose or revoke at will for any reason at all. That’s it. There’s no economic claim or right inherent in a piece of money. As Gertrude Stein famously said of Oakland, there’s no there there. Why is this examination of underlying real world meaning so important? It’s important because there is no positive long-term expected return from trading one country’s economic license for another country’s economic license. There is a positive long-term expected return from trading money for stock. There is a positive long-term expected return from trading money for bonds. There is a positive long-term expected return from trading money for commodities and other real assets. But there is no positive long-term expected return from trading money for money. Unfortunately, we’ve been trained and encouraged – often under the linguistic rubric of “science” – to think of ANY new trading vehicle or security, particularly one that taps into as huge a market as foreign exchange, as a good thing for our portfolios. We are deluged with the usual narratives that alternatively seek to tempt us and embarrass us into participation. On an individual level we are told stories of savvy investors who look and act like we want to look and act, taking bold advantage of the technological wizardry (look! it’s a heat map! that changes color while I’m watching it!) and insanely great trade financing now at our fingertips in this, the best of all possible worlds. On an institutional level we are told stories of liquidity and non-correlation (what? you don’t understand what an efficient portfolio frontier is? and you call yourself a professional?), both good and necessary things, to be sure. But not sufficient things, at least not to cast the powerful magic that is diversification. There are only a few sure things in investing. First, taxes and fees are bad. Second, compound growth is a beautiful thing. Third, portfolio diversification works. At Salient we spend a lot of time thinking about what makes diversification work more or less well for different types of investors, and if you’re interested in questions like “what’s the difference between de-risking and diversification?” I heartily recommend our latest white paper (” The Free Lunch Effect “) to you. One thing we don’t do at Salient is include currency trading within our systematic asset allocation or trend-following strategies. Why not? Because Rule #1 for tapping into the power of portfolio diversification is that you don’t include things that lack a long-term positive expected return. Just because we can trade currency pairs easily and efficiently doesn’t mean that we should trade currency pairs easily and efficiently, any more than cloning dinosaurs because they could was a good idea for the Jurassic Park guys. The point of adding things to your portfolio for diversification should be to create a more effective umbrella, not just a bigger umbrella. I like a big umbrella just as much as the next guy, but not if I’m going to get wet every time a forex storm whips up. So if not for diversification, why do smart people engage in currency trading? There’s a good answer and a not-as-good answer to that question. The good answer is that you have an alpha-driven (i.e. private information-driven) divergent view on the terms of the government license embedded within any modern currency. This is why Stanley Druckenmiller is an investing god, and it’s why anyone who put money with him before, during, and after he and George Soros “broke the Bank of England” in 1992 has been rewarded many times over. The not-as-good answer is that you have identified a predictive pattern in the symbols themselves. I say that it’s not as good of an answer, but I’m not denying that there is meaning in the pattern of market symbols. On the contrary, I think there is real information regarding internal market behaviors to be found in the inductive study of symbolic patterns. This information is alpha, maybe the only consistent source of alpha left in the world today, and acting on these patterns is what good traders DO. But because it’s inductively derived, anyone else can find your special pattern, too. Or if they can’t, it’s because you’ve carved out a nice little parasitic niche for yourself that’s unlikely to scale well. More corrosively, the natural human tendency is to ascribe meaning to these patterns beyond the internal workings of the market, something that makes no more sense than to say that goose entrails have meaning beyond the internal workings of the goose. The meaning of the Swiss franc didn’t change just because you had a consistent pattern of market behavior around the EURCHF cross. Deviation in the expected value of the Swiss franc in Euro terms did not become normally distributed just because you can apply statistical methodology to the historical exchange rate data. I get so annoyed when I read things like “this wasn’t just the greatest shock in the history of forex, it was the greatest shock in the history of traded securities! a 30 standard deviation event!” Please. Stop it. Just because you can impose a normal distribution on the EURCHF cross doesn’t mean that you should . And if you’re making investment decisions because you think that this normal distribution and the internal market stability it implies is somehow “real” or has somehow changed the fundamental nature of what a currency IS … well, eventually that category error will wipe you out. Sorry, but it will. I don’t mean to be snide about any of this (although sometimes I can’t help myself). The truth is that an aggregation of highly probabilistic entities will always surprise you, whether you’re building a baseball team or an investment portfolio. Portfolio construction – the aggregation of symbols and symbols of symbols, all of which are ultimately based on massive amounts of real world activities that may have vastly different meanings and underlying probabilistic natures – is a really difficult task under the best of circumstances for a social animal that evolved on the African savanna for an entirely different set of challenges. And these are not the best of circumstances. No, the rules always change as the Golden Age of the Central Banker begins to fade. The SNB decision was a wake-up call, whether or not you were directly impacted, to re-examine portfolios and investment behavior for category errors. We all have them. It’s only human. The question, as always, is whether we’re prepared to do anything about it.