Tag Archives: handle

Duke Energy: A Utility Stock For Your Income Portfolio For 2015

Summary Company’s long-term performance will be positively affected by planned growth investments. Growth investments will drive its rate base and earnings growth in the long run. DUK remains committed to achieving its targeted dividend payout ratio of 65%-70%. I reiterate my bullish stance on Duke Energy (NYSE: DUK ). In this article, I will discuss in more detail the ongoing capital expenditures that the company is making, which will portend well for its financial performance. Also, I will briefly discuss the 4Q’14 earnings outlook. DUK has been progressing well with its healthy capital expenditures in regulated operations. The company’s planned capital expenditures for the next five years remain healthy, and I believe DUK will deliver decent earnings growth in the long run. Moreover, the effect of the healthy earnings growth will improve its cash flow base, due to which the company will make hefty dividend payments in the long run. The stock offers an attractive dividend yield of 3.6%, which makes it a good investment option for dividend-seeking investors. Smart Growth Investments set to Improve DUK’s Financial Performance U.S. utility stocks delivered healthy performances in 2014. Moving forward, I believe 2015 will be another good year for the utility sector. As far as DUK is concerned, the company has carved out its plans to deliver a healthy performance in the long term through acceleration in capital expenditure for long-term growth generating projects. As per its growth plans, focused on regulated operations, the company is planning to spend approximately $16-$20 billion on several growth projects from 2014 to 2018, focused on its new power generation projects. The company revealed that it will be constructing three major generation projects in Florida, with an investment of approximately $1.9 billion . Also, DUK is planning to build a 1,640MW joint cycle plant worth $1.5 billion. In addition, the company has been making progress with its two new combustion turbine plants in Suwannee, which are expected to be in service by the end of 2018. Moreover, regulators have approved DUK’s project to build a 750MW Lee natural gas plant in South Carolina, which will start providing services by the end of 2017. The value of these growth investments lies in the betterment of the company’s power generation capacity due to a significant improvement in regulated operations, which will portend well for its rate base and earnings growth in the long run. Along with power generation projects, DUK has been gradually increasing its renewable energy portfolio. So far, the company is progressing well with the constructions of its 400MW wind energy project and 100MW solar project. DUK has recently acquired a 20MW solar project from Geenex and ET solar Energy Corporation; the project’s site, being located in Dominion North Carolina Power’s service area, will allow the company to generate revenue by selling electricity generated from the project for a period of 15 years. In future, DUK will be making more investments in its renewable generation projects. All these renewable energy generation investments will not only diversify the company’s generation mix, but will help it meet environmental standards. I believe DUK’s increased focus on renewable energy sources will deliver a significant upside to the company’s financial performance in the long run. In addition, DUK is actively evaluating all growth opportunities in international markets to generate growth in the long run. Also, DUK is conducting a strategic examination of international operations to get tax benefits of approximately $1.7 billion . The company’s strategic overview of international operations is still in progress, but by the time DUK will start pursuing tax saving initiatives for its international operations, its stock price will be positively affected. Owing to DUK’s healthy capital expenditures for the next five years, active investments in renewable energy resources and international growth opportunities, I believe the company’s earnings will be positively affected in the long term. Analysts are expecting that DUK’s long-term earnings will grow at approximately 4.76% , better than Southern Company’s (NYSE: SO ) earnings growth of 3.63% . The company is scheduled to report its 4Q’14 earnings next month. The company will provide an update on its future capital expenditure outlook; any increases in planned capital expenditures will positively affect the company’s growth potential and stock price. Also, the company will provide the 1Q’15 and full year 2015 earnings guidance. Analysts are expecting DUK to report an EPS of $0.88 for 4Q’14. In the last four quarters, the company reported three earnings beats. The one earnings miss was due to an impairment charge related to Midwest assets. I believe that as the company has finalized the sale of Midwest assets, it will report strong earnings for 4Q’15. The following table shows the actual EPS and consensus EPS estimates for the last four quarters. (click to enlarge) Source: Yahoofinance.com Healthy Returns DUK has been sharing its success with shareholders through dividends. The company recently announced a quarterly dividend payment of $0.795 , which marked its 85th consecutive year of dividend payments. The company currently offers a healthy dividend yield of 3.60% . The company’s impressive cash flows have been backing these impressive dividend payments, as shown below. DUK’s healthy growth prospects indicate that its cash flow productivity will improve in the years ahead, helping it affirm its commitment to rewarding shareholders through dividend payments. Owing to its ability to pay dividends consistently in upcoming years, I believe DUK remains a good investment option for shareholders. Moreover, the company can use $2.8 billion in cash proceeds from the Midwest assets sale to repurchase shares or boost dividends. Owing to DUK’s shareholder-friendly cash return policy, I believe the company will utilize all growth prospects that could support its healthy cash return policy in order to ensure consistent dividend increases in the years ahead. The following table shows the ongoing increases in dividend per share, ROE, dividend payout ratio and dividend coverage for the company, for 2012 and 2013. The table also includes my estimated figures for 2014 and 2015. (Note *Dividend Coverage Ratio = Operating Cash Flow/Annual Dividends) Dividend Per Share Dividend Payout Dividend Coverage ROE 2012 $3.03 70% 3x 9.5% 2013 $3.12 71.7% 2.9x 6.3% 2014(E) $3.15 69.6% 3.2x 7.6% 2015(E) $3.25 68.7% 3.8x 7.7% Source: Company’s Reports and Equity watch’s Calculations Using Estimates Conclusion DUK’s long-term performance will be positively affected by planned growth investments. The growth investments, directed at improving the company’s operational performance, will drive its rate base and earnings growth in the long run. Also, DUK’s healthy growth prospects will portend well for the betterment of its cash flow base, which will allow the company to consistently increase dividends. Moreover, DUK remains committed to achieving its targeted dividend payout ratio of 65%-70% . Due to the aforementioned factors, I remain bullish on DUK.
Europe’s QE Experiment: Adding Stock ETF Exposure And Hedging Against The Unforeseen

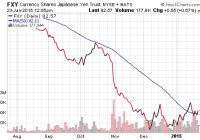
The scope and size of the European Central Bank’s latest stimulus effort has delighted the worldwide investing community. The countries/regions that are in the process of actively weakening their currencies are seeing the greatest pop in near-term equity prices. All of the safer haven currency proxies have gained ground in 2015, whereas the overwhelming majority of global growth-oriented currency ETFs are hittng 52-week lows. The scope (current euro-zone member nations) and size ($1.1 trillion euros) of the European Central Bank’s latest stimulus effort has delighted the worldwide investing community. In fact, many began betting on a monumental quantitative easing “project” the minute that Europe registered year-over-year deflation of -0.2% for the month of December. This can be seen in dollar-denominated ETF performance since the start of the 2015. The Anticipation Game: Investors Bet On Most Recent “QE” Beneficiaries Approx YTD% iShares Currency Hedged MSCI Germany ET F (NYSEARCA: HEWG ) 8.5% Deutsche X-trackers MSCI Europe Hedged Equity ETF (NYSEARCA: DBEU ) 4.3% WisdomTree Korea Hedged Equity ETF (NASDAQ: DXKW ) 0.9% WisdomTree Japan Hedged Equity ETF (NYSEARCA: DXJ ) 0.3% SPDR S&P 500 Trust ETF (NYSEARCA: SPY ) 0.0% The outperformance by Germany as well as Europe over less recent “quantitative easers” is worthy of note. It tells us that the countries/regions that are in the process of actively weakening their currencies – the ones that are actively lowering the costs of servicing their sovereign debt by the most significant amounts via ultra-low yields – are seeing the greatest pop in near-term equity prices. Indeed, the vast majority of currency ETFs are hitting 52-week lows. The ones that are not? The safer haven currency proxies which include the CurrencyShares Swiss Franc Trust ETF (NYSEARCA: FXF ), the CurrencyShares Japanese Yen Trust ETF (NYSEARCA: FXY ), the PowerShares DB USD Bull ETF (NYSEARCA: UUP ) and SPDR Gold Trust ETF (NYSEARCA: GLD ). All of these safer haven currency proxies have gained ground in 2015, whereas the overwhelming majority of global growth-oriented currency ETFs are hittng 52-week lows. Safer Haven Proxies Are Flourishing, Global Growth Proxies Are Languishing Approx YTD % FXF 13.5% GLD 9.1% UUP 4.8% FXY 1.7% CurrencyShares Australian Dollar Trust ETF (NYSEARCA: FXA ) -2.5% CurrencyShares British Pound Sterling Trust ETF (NYSEARCA: FXB ) -3.6% CurrencyShares Canadian Dollar Trust ETF (NYSEARCA: FXC ) -6.3% CurrencyShares Euro Trust ETF (NYSEARCA: FXE ) -7.0% For those who do not understand why the yen strengthens in risk-off environments, you may need a refresher on the “carry trade.” Investors borrow the low yielding yen to invest in higher yielding assets or higher appreciating assets. However, there is a serious consequence for playing the game at the wrong time; specifically, the yen rise in value when institutions and hedge funds rapidly sell stocks, higher-yielding bonds and higher-yielding currencies to avoid paying back loans in a more expensive yen. The Japanese currency can rise rapidly and the reverse carry trade can take on a life of its own. During January’s volatility in U.S. stock assets, FXY has crossed above its 50-day moving average. If the risk off volatility has truly run its course due to the European Central Bank’s mammoth QE promise and the Bank of Japan’s existing promises, FXY should stabilize rather than climb. Conversely, additional gains for FXY would suggest additional unwinding of the yen carry trade as well as a high probability of heavy volume selling of stock assets. The potential for the carry trade to unwind and the yen’s historical record as a safer haven currency is the reason for its inclusion in the FTSE Custom Multi-Asset Stock Hedge Index. This index that my Pacific Park Financial colleague and I created with FTSE-Russell- the one that many are already calling “MASH” – holds the franc, yen, dollar and gold. It also owns long maturity treasuries, zero coupon bonds, inflation-protected securities, munis, German bunds and Japanese government bonds. Year-to-date, the FTSE Custom Multi-Asset Stock Hedge Index is up 4.5%. Shouldn’t investors just play market-based securities in a way that has worked so well during the Federal Reserve’s QE3? The shock-and-awe, 1.5 trillion dollar, open-ended, bond-buying bazooka that gave U.S. stocks double-digit percentage gains in 2012, 2013 and 2014? After all, the European Central Bank (ECB) is proffering $1.1 trillion euros into 2016. The problem in the comparison between these programs is that 80% of the sovereign bonds are being bought by the national central banks and not the the ECB itself. This means that each country (e.g., Austria, Belgium, France, Germany, Greece, Italy, Spain, etc.) is responsible for its own default risk. It follows that I might be willing to add a fund like HEWG to my barbell portfolio , alongside several existing components such as the iShares S&P 100 ETF (NYSEARCA: OEF ), the Health Care Select Sect SPDR ETF (NYSEARCA: XLV ) and the Vanguard Dividend Appreciation ETF (NYSEARCA: VIG ). I might be a bit more skeptical of the i Shares Currency Hedged MSCI EAFE ETF (NYSEARCA: HEFA ), simply because of the drag of extreme debtors on the periphery of Europe (e.g., Spain, Portugal, Greece, etc.). By the same token, I have slowly increased exposure over the last three months to a number of existing holdings on the other side of the barbell. They include GLD, the i Shares 10-20 Year Treasury Bond ETF (NYSEARCA: TLH ), the Vanguard Extended Duration Treasury ETF (NYSEARCA: EDV ) and, more recently, FXY. Remember, multi-asset stock hedging does not mean that your dynamic hedging loses when riskier stock assets win. On the contrary. Both sides of the barbell tend to perform in late-stage bulls. Disclosure: Gary Gordon, MS, CFP is the president of Pacific Park Financial, Inc., a Registered Investment Adviser with the SEC. Gary Gordon, Pacific Park Financial, Inc, and/or its clients may hold positions in the ETFs, mutual funds, and/or any investment asset mentioned above. The commentary does not constitute individualized investment advice. The opinions offered herein are not personalized recommendations to buy, sell or hold securities. At times, issuers of exchange-traded products compensate Pacific Park Financial, Inc. or its subsidiaries for advertising at the ETF Expert web site. ETF Expert content is created independently of any advertising relationships.

Gain Exposure To U.S. Infrastructure Boom With GII

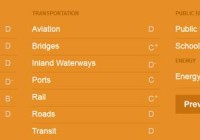
Summary Poor American infrastructure has an overall Grade of D+ by American Society of Civil Engineers. Congested roads alone cost America $101 billion in fuel and wasted time in 2010 and last major infrastructure work was in 1956 by President Eisenhower. President Obama called for greater infrastructure work in his 2015 State of the Union Address and is expected to push for wider infrastructure development. GII is a global infrastructure ETF loaded with world class infrastructure companies that are likely to be called to service in the upcoming infrastructure upgrade. Investors can add a small position of GII before adding to it. America’s Infrastructure Investment Opportunity The American Society of Civil Engineers (ASCE) is the premier organization with expertise on infrastructure works in America founded since 1852. ASCE produces a grading score of condition and performance American infrastructure every 4 years and the latest report published on 2013 was given an overall grade of D+. Their grading system follows the typical school grades where A represents Excellent, B represents Good, C represents Mediocre, D represents Bad and F represents failing. So American infrastructure is only 1 grade above failure and graded as bad. Before we go further in the economic implication of this state of disrepair for American infrastructure, let us have an idea of the scope of infrastructure by the grades of the categories of Water and Environment, Transportation, Public Facility and Energy below. (click to enlarge) Source: American Society of Civil Engineers ASCE has estimated that America requires $3.6 Trillion of infrastructure investment by 2020 to meet the infrastructure needs of America. This represents a huge investment opportunity which we can tap into through a diversified holding of infrastructure related companies through an Exchange Traded Fund (NYSEMKT: ETF ) which will be recommended at the end of this article. Cost Poor Infrastructure We will use the transportation category with roads in particular to illustrate the cost of poor infrastructure. We are all familiar with traffic congestion during rush hour where we are forced to endure hours on the road. This is a very real life example of the cost of poor infrastructure works. It is estimated that an average of 34 hours spent waiting on roads and burning 1.9 billion gallon of oil costing motorists $101 billion in 2011. 42% of America’s major urban highways remains congested and 32% of major America’s roads remain in poor or mediocre condition. (click to enlarge) This is the result of steadily falling investments on transportation as seen in the chart above. President Obama prevented a temporary boost by adding provisions for transportation investment in the 2009 Recovery Act but they were a short term boost and have since been depleted. Overall they are not sufficient to reverse the aging roads of America. The last major infrastructure work was done 59 years ago when President Dwight Eisenhower signed the Federal Aid-Highway Act of 1956 , which added 41,000 miles of interstate highways that linked different states of America together. It was completed in 1980 and represents 1% of road network in America but it carries 23% of all railway traffic. It was heralded as a major achievement at that time but 35 years later more funds are needed to maintain this vast network of roads. Obama Calls for Action During the State of the Union Address on 21 January 2015 before Congress, President Obama made the following rallying call for the United States to upgrade its failing infrastructure. “21st century businesses need 21st century infrastructure – modern ports, stronger bridges, faster trains and the fastest internet. Democrats and Republicans used to agree on this. So let’s set our sights higher than a single oil pipeline. Let’s pass a bipartisan infrastructure plan that could create more than thirty times as many jobs per year, and make this country stronger for decades to come.” There are various laws that can make this happen including the popular Transportation Infrastructure Finance and Innovation Act (TIFIA) which can be expanded further and modernizing the Federal Financing Bank (FFB) to allow for greater Public Private Partnership (NYSE: PPP ). Australia’s experiment with PPP in the 1990s should be instructive to benchmark expectations of return. Primary infrastructure returned a yield of 7%-8% and secondary infrastructure returned 13%-15%. Obama tried to make transportation infrastructure a priority in 2014 and we expect him to build on his momentum of an improving economy to try again this year in 2015. With third quarter economic growth of 5% at 11 year high, we expect Obama to seal his legacy with a wide range of infrastructure works. Infrastructure ETF Capital protection is the key word for investors and this can be achieved by investing in a diversified portfolio of stocks that an exchange traded fund ( ETF ) can provide. The SPDR S&P Global Infrastructure ETF (NYSEARCA: GII ) includes world class infrastructure companies that are likely to be called upon to build the US infrastructure. The top companies in this ETF include Transurban Group ( OTCPK:TRAUF ) (5.13%), Atlantia ( OTC:ATASF ) (4.14%), Duke Energy Corporation (NYSE: DUK ) (3.54%), Enbridge (3.43%) and Abertis Infraestructuras SA ( OTCPK:ABRTY ) (3.36%). I would provide a brief description of these companies for investors to have an understanding of the types of companies that they are gaining exposure with GII. Transurban manages and develops urban toll road networks in Australia and North America. Atlantia is an Italian company that constructs and operates toll roads. Duke Energy, headquartered in Charlotte, North Carolina, is the largest electric power holding company in the United States. Enbridge is an energy delivery company based in Canada specializing in the transport and distribution of crude oil, natural gas, and other liquids. It has 41.79% weighting in Utilities, 39.79% in Industrials, 17.67% in Energy and 0.76% in Basic Materials. Abertis is a Spanish company that operates motorways in Europe and airports in cities like London and Orlando. (click to enlarge) We can see that GII has been ranging from $47 to $49 past 2 weeks and recent price action have a bullish slant to it. GII is decently priced at with 19 times price earnings and it has a market capitalization of $111.73 million and volume of 2,592. Investors can consider taking a small exposure of GII and look out for further action on the Obama Administration before adding to their position.