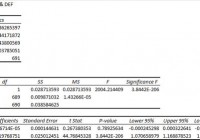
Summary I’m taking a look at DEF as a candidate for inclusion in my ETF portfolio. The only weakness I see is that the ETF has a higher expense ratio as it turns over assets more frequently than I would want. The correlation and standard deviation is very attractive. The data is based on solid liquidity, so feel it is fairly reliable. I’m keeping DEF in the running for my entire portfolio due to the price stability of the ETF. Investors should be seeking to improve their risk adjusted returns. I’m a big fan of using ETFs to achieve the risk adjusted returns relative to the portfolios that a normal investor can generate for themselves after trading costs. I’m working on building a new portfolio and I’m going to be analyzing several of the ETFs that I am considering for my personal portfolio. One of the funds that I’m considering is the Guggenheim Defensive Equity ETF (NYSEARCA: DEF ). I’ll be performing a substantial portion of my analysis along the lines of modern portfolio theory, so my goal is to find ways to minimize costs while achieving diversification to reduce my risk level. What does DEF do? DEF attempts to track the total return (before fees and expenses) of the Sabrient Defensive Equity Index. At least 90% of the assets are invested in funds included in this index. DEF falls under the category of “Large value”. Does DEF provide diversification benefits to a portfolio? Each investor may hold a different portfolio, but I use the SPDR S&P 500 Trust ETF (NYSEARCA: SPY ) as the basis for my analysis. I believe SPY, or another large cap U.S. fund with similar properties, represents the reasonable first step for many investors designing an ETF portfolio. Therefore, I start my diversification analysis by seeing how it works with SPY. I start with an ANOVA table: (click to enlarge) The correlation is 86%. That is a reasonable correlation level under Modern Portfolio Theory. Lower levels of correlation allow more of the risk associated with individual investments to be effectively diversified away. For an ETF that will hold several large U.S. equity securities, that’s a very appealing level of correlation as long as the liquidity is good. Standard deviation of daily returns (dividend adjusted, measured since April 2012) The standard deviation is amazing. For DEF it is .576%. For SPY, it is 0.748% for the same period. SPY usually beats other ETFs in this regard. Because the standard deviation is fairly low and the correlation is pretty good, I’m expecting to see substantial diversification benefits that would make DEF a reasonable fit in most portfolios. Liquidity is moderate Over my sample period the average trading volume was around 35,000 shares per day. Over the last ten days it was over 55,000. Mixing it with SPY I also run comparisons on the standard deviation of daily returns for the portfolio assuming that the portfolio is combined with the S&P 500. For research, I assume daily rebalancing because it dramatically simplifies the math. With a 50/50 weighting in a portfolio holding only SPY and DEF, the standard deviation of daily returns across the entire portfolio is 0.639%. Notice that this is significantly lower than SPY alone. With 80% in SPY and 20% in DEF, the standard deviation of the portfolio would have been .700%. If an investor wanted to use DEF as a supplement to their portfolio, the standard deviation across the portfolio with 95% in SPY and 5% in DEF would have been .735%. Why I use standard deviation of daily returns I don’t believe historical returns have predictive power for future returns, but I do believe historical values for standard deviations of returns relative to other ETFs have some predictive power on future risks and correlations. Yield & Taxes The distribution yield is 2.5%. It’s a reasonable yield for an investor trying to avoid excessive trading costs. A decent distribution yield can help investors avoid feeling a need to open their portfolio up too frequently. Expense Ratio The ETF is posting .66% for a net expense ratio. I want diversification, I want stability, and I don’t want to pay for them. I view expense ratios as a very important part of the long term return picture because I want to hold the ETF for a time period measured in decades. I’m not thrilled with the expense ratio, but it can be tricky to find ETFs with such a low standard deviation of returns and moderate correlation. Market to NAV The ETF is at a .02% premium to NAV currently. Premiums or discounts to NAV can change very quickly so investors should check prior to putting in an order. The ETF is large enough and liquid enough that I would expect the ETF to stay fairly close to NAV. Generally, I don’t trust deviations from NAV and I will have a strong resistance to paying a premium to NAV to enter into a position. I wouldn’t worry about .02%. Largest Holdings The diversification within the ETF may be a substantial part of the lower standard deviation. (click to enlarge) Conclusion This ETF looks like a contender. In the interest of reducing the deviation of returns I find defensive funds appealing as part of a diversified portfolio. The correlation at 86% isn’t too bad and the fund still showed decent returns and holds some of the same companies as SPY while being less volatile. There are some clear diversification benefits here. If an investor was going to hold only SPY or DEF over the next 20 years, I’d expect SPY to end higher. However, the appealing aspect of DEF is that it can reduce the risk of the portfolio. In the context of a more complicated portfolio that is being rebalanced and contains some more volatile ETFs, I like the role of DEF. The average liquidity isn’t too bad. The days with no change in dividend adjusted close is high enough to give me a little concern (18), but there were no days that actually reported 0 trading volumes. Therefore, I think the liquidity is fairly decent and I wouldn’t treat it as a major concern. Having a decent distribution yield doesn’t hurt either in the context of a long term investor. There’s only one area that concerns me. The ETF is posting a fairly high expense ratio relative to the other strong contenders for this space in my portfolio. The portfolio turnover is also very high at 87%. That surprised me a bit. For a defensive ETF, I would expect less shifting in the positions. For comparison, SPY has a turnover ratio of 3%. One strike against the ETF won’t be enough to eliminate it from consideration. I’ll admit that the largest position being Staples makes me scratch my head a little bit, but the position was still under 1.5% so I’d say the diversification is solid and I wouldn’t worry about it. Investors should notice that the ETF does also hold some significant positions in REITs. That doesn’t bother me, but each investor has a different situation. I was expecting to use an ETF dedicated to REITs to increase my exposure in that regard. Disclosure: The author has no positions in any stocks mentioned, and no plans to initiate any positions within the next 72 hours. (More…) The author wrote this article themselves, and it expresses their own opinions. The author is not receiving compensation for it (other than from Seeking Alpha). The author has no business relationship with any company whose stock is mentioned in this article. Additional disclosure: Information in this article represents the opinion of the analyst. All statements are represented as opinions, rather than facts, and should not be construed as advice to buy or sell a security. Ratings of “outperform” and “underperform” reflect the analyst’s estimation of a divergence between the market value for a security and the price that would be appropriate given the potential for risks and returns relative to other securities. The analyst does not know your particular objectives for returns or constraints upon investing. All investors are encouraged to do their own research before making any investment decision. Information is regularly obtained from Yahoo Finance, Google Finance, and SEC Database. If Yahoo, Google, or the SEC database contained faulty or old information it could be incorporated into my analysis. The analyst holds a diversified portfolio including mutual funds or index funds which may include a small long exposure to the stock.