Utility CEFs For Defensive Income
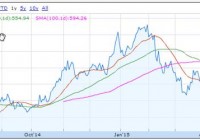
Summary Utilities have gone from overvalued to a more reasonable valuation. At appropriate valuation, the utility sector offers opportunity for defensive income investing. This article summarizes nine utility closed-end funds with a median distribution yield of 7.6%. Only a few months ago the utility sector was overvalued. Such is the nature of a bond-substitute investment when bond yields collapse and investors look for safe income elsewhere. But the sector has given back 15% since last January’s high and overvaluation is much less the case. (click to enlarge) Figure 1: Dow Jones Utility Average ( google finance ). Although still about 7% above the 52 week low, the sector has been trading below its 20, 50 and 100 day simple moving averages, and appears to have found support recently (see chart in Fig. 1). An income investor wary about the prospects of a looming correction may well be considering this background as a reason to focus attention on this most defensive of sectors. When I’m looking for income investments, my first stop is to look to closed-end funds. For one thing, CEFs can provide excellent income relative to ETFs or holding individual stocks. For another, CEFs tend to overreach sector movements, so when a sector like utilities approaches bargain territory, sector CEFs may exaggerate the apparent value. Utility Closed End Funds Cefconnect.com lists nine utility funds. These are summarized below: Fund Market Cap % USA Blackrock Utility & Infrastructure Trust (NYSE: BUI ) $314,921,520 72.7% Duff & Phelps Global Utility Income Fund Inc. (NYSE: DPG ) $694,255,355 57.0% Wells Fargo Advantage Utilities & High Income Fund (NYSEMKT: ERH ) $108,982,680 46.4% Gabelli Global Utility & Income Trust (NYSEMKT: GLU ) $77,567,946 61.5% Gabelli Utility Trust (NYSE: GUT ) $298,074,054 100.0% Macquarie/First Trust Global Infrastr/Util Div & Inc Fund (NYSE: MFD ) $137,707,333 41.8% Macquarie Global Infrastructure Total Return Fund Inc. (NYSE: MGU ) $306,986,780 36.6% Cohen & Steers Infrastructure Fund Inc (NYSE: UTF ) $1,877,774,640 58.0% Reaves Utility Income Fund (NYSEMKT: UTG ) $844,916,800 100.0% Two of the nine are purely domestic; the others are global in scope. All but one of the funds currently sells at a discount to NAV. GUT maintains a premium of 28.4%. This leaves the Reaves Utility Fund as the only wholly domestic utility CEF to be priced at a discount (-4.15%). Figure 2. Premium/Discount status of Utility CEFs ( cefanalyzer.com ) Distributions Distributions range from a low of 6.1% to a high of 8.7%. Median distribution for the nine funds is 7.6%. Figure 3. Utility CEF distributions on price and NAV (cefanalyzer.com). Typical of closed-end funds, these distributions exceed that of utility ETFs such as, for example, the Guggenheim S&P 500 Equal Weight Utilities ETF (NYSEARCA: RYU ) with a current yield of 5.3% or the iShares Global Utilities ETF (NYSEARCA: JXI ) currently yielding 3.14%. The enhanced yields are achieved by the usual equity closed-end fund strategies of leverage (for 8 of the funds) and option-writing for the remaining fund. In addition, some of the funds generate income from utility debt instruments including bonds and preferred shares. (click to enlarge) Figure 4. Percent leverage for utility CEF portfolios (cefanalyzer.com). Total Returns The following charts show total returns on NAV and Market Price for 1, 3 and 12 months. Figure 5. Total return for utility CEFs on NAV (top) and Market Price (bottom) basis (cefanalyzer.com). None has turned in a gain on NAV for the past month, as one would expect from the utility sell-off noted in Figure 1 above. GUT has managed a positive price return over that time as its premium has increased from an already high 25% to 28%. During this time most of the remaining funds have seen their discounts deepen. Z-Scores Looking carefully at these return performance charts it becomes clear that for several of the funds, price returns are not tracking NAV returns. BUI, for example has suffered declines in market price while turning in respectable gains on NAV relative to its peers. This situation can be demonstrated most effectively by looking at Z-scores, which quantify the relationship between current premium/discount and mean premium/discount status. Figure 6. Z-Scores for 3, 6, and 12 months for utility CEFs (cefanalyzer.com). The Z-scores for GUT illustrate the extent to which its premium has been increasing relative to its average status for this metric. The current premium is more than 2 standard deviations greater than the average premium for each of the time periods shown. Contrast that with BUI whose discounts for 3 and 12 months are approximately 3 standard deviations below their means with Z-scores of -3.1 for both 3 and 12 months and -2.4 for 6 months. UTF, DPG and ERH also have low negative Z-scores. If one believes that reversion to mean discount/premium status is a likely predication, then these three funds would seem attractively priced on this basis. Summary and Selections Investors seeking high-income yield with defensive characteristics may want to look carefully at the utility sector. I think it’s a fair generalization that defensive investing is not something one normally associates with leverage, so the inclination would be to look to funds with no or minimal leverage. For the nine closed-end funds that comprise the sector’s offerings, only one is effectively unlevered (BUI, 0.9% leverage). The remaining funds carry 15% to 36% leverage. Investors who choose to focus on domestic utilities have only two choices: GUT and UTG. To my thinking there is no contest between the two; GUT’s unsustainable premium takes it out of my consideration. UTG sells at a discount of -4.1%, but this is somewhat higher than its 3 and 12 month mean discounts, and higher than all but one of the 8 discounted funds (MFG at -1.8%). UTG’s distribution yield (6.24%) is the second lowest of the group. The remaining funds carry discounts from -12 to -14%. One of these stands out for having an exceptionally deep discount relative to its historical status. BUI’s yield is an attractive 7.8%, a bit above the median yield of 7.6% for all the funds. These factors, along with its unleveraged status, makes it my choice from this group of funds. In closing I’d like to present a snapshot of the portfolios of my two picks here. Both are nearly entirely equity. UTG includes 4% MLPs and less than 1% preferred stock and corporate bonds. Both are more diverse than strict utility-sector portfolios. BUI holds 53% Utilities, 25.7% Energy and 12.5% Transportation. UTG breaks its portfolio down by industry rather than sector, with the top three being Multi-Utilities, 27.8%; Oil, Gas & Consumable Fuels, 18.5%; and Transportation Infrastructure, 16.03%. Top ten holdings for each are: UTG NextEra Energy Inc (NYSE: NEE ) 5.25% DTE Energy Holding Company (NYSE: DTE ) 4.87% ITC Holdings Corp (NYSE: ITC ) 4.72% Union Pacific Corp (NYSE: UNP ) 4.66% Verizon Communications Inc (NYSE: VZ ) 4.25% American Water Works Co Inc (NYSE: AWK ) 3.94% Duke Energy Corporation (NYSE: DUK ) 3.65% SCANA Corp (NYSE: SCG ) 3.64% Dominion Resources Inc (NYSE: D ) 3.57% BCE Inc (NYSE: BCE ) 3.45% Time Warner Cable Inc A (NYSE: TWC ) 3.10% BUI NextEra Energy Inc 4.35% CMS Energy Corp (NYSE: CMS ) 3.86% Sempra Energy (NYSE: SRE ) 3.81% Dominion Resources Inc 3.77% Dominion Midstream Partners LP (NYSE: DM ) 3.62% Shell Midstream Partners LP (NYSE: RDS.A ) 3.52% Duke Energy Corporation 3.37% National Grid Plc (NYSE: NGG ) 3.31% Atlantia SPA ( OTCPK:ATASY ) 2.96% American Water Works Co Inc 2.78% Disclosure: The author has no positions in any stocks mentioned, but may initiate a long position in BUI over the next 72 hours. (More…) The author wrote this article themselves, and it expresses their own opinions. The author is not receiving compensation for it (other than from Seeking Alpha). The author has no business relationship with any company whose stock is mentioned in this article.