Tag Archives: gold

12% In 12 Years

There are too many articles telling people they cannot beat the market. It can be done, and at only 80% in the market. During his seminars, Dave Ramsey often talks about averaging 12%, and critics say that is not possible. It is possible. With a little leg work, research, mathematical skills, and strategic allocation, there is a method that works, and a track record to prove it. It was a pretty simple idea in 2003, and I wanted to see if it would work. I wanted to see if it was possible to beat the market using some of the basic strategies I had studied. I had committed myself to studying Graham, Buffett, Fisher, Zweig, Dreman, O’Shaughnessy, and Domash, and was ready to get to work. I used some pretty basic concepts to find my stock selections. First, I used the old MSN Money Stock Screener, which no longer exists to screen for Bulletproof stocks as outlined by Harry Domash in his original book, Fire Your Stock Analyst . With that, I determined an intrinsic value of each stock using the techniques from Mary Buffet ‘s book , where she outlines Warren Buffet’s techniques for stock selection. With a list of stocks that had at least a 15% discount to intrinsic value, I allocated my Marketocracy Hybrid Fund portfolio in equal lots based on Large-Cap, Mid-Cap, Small-Cap and International. These were the initial companies I bought on January 30, 2003: Symbol Name Notes AJG GALLAGHER(ARTHUR J.) BFR BBVA BANCO FRANCES SA BPT BP PRUDHOE BAY ROYALTY CRRC COURIER CORP DECA DECOMA INTL ‘A’ Acquired by MG: CN DOM DOMINION RES BLACK WARRIOR TR HRL HORMEL FOODS IMH Invictus MD Strategies Corp Listed only in Canada IMO IMPERIAL OIL LTD ITT ITT Corp KNX KNIGHT TRANSPORTATION MHO M/I Homes Inc MRK MERCK & CO NAT Nordic American Tankers Ltd OTCQB: OTCQB:NOVC Novation Companies Inc OTC NTZ INDUSTRIE NATUZZI ADS PAA PLAINS ALL AMER PIPELINE PEP PEPSICO INC PII POLARIS INDUSTRIES PTSI P.A.M. TRANSPORTATION SVCS QSII QUALITY SYSTEMS OTCQB: OTCQB:RILY B. Riley Financial Inc SGP SCHERING-PLOUGH Acquired by MRK SSL SASOL LTD ADR THO THOR INDUSTRIES TSMA TESMA INTL ‘A’ Acquired by MGA OTCPK: OTCPK:VCYE Velocity Energy Inc OTC WCSTF WESCAST IND INC CL A Acquired by Sichuan I would say I was off to a pretty good start that first year with a 33.3% return, after fees and commissions. This compared favorably with the S&P 500 at 33.25%. By 2005, my strategy changed a bit to include a 20% allocation for the new bond ETFs from iShares . I wanted to mirror what I was doing in real life as much as possible, and I never looked back. Since I started this approach of finding undervalued stocks that are financially safe and undervalued, I have averaged 12.40% over the last 12 years. In the meantime, the S&P 500 averaged 9.54%. Think about that. Including fees, I have a strategy that beats the market by an average of almost 300 basis points over the last 12 years, and that includes a 20% allocation for fixed income. It also includes all fees and commissions that are bane of all managed funds. This is a strategy that has a 5.26 alpha, 0.73 beta, and a 1.58 gain/loss ratio. The data is here for all to see. So why did I bring up Dave Ramsey? When Ramsey speaks at his financial seminars, he always touts 12% as the average annual return for a particular mutual fund since 1934. Professionals in the field recognize the mutual fund he describes as American Funds’ Investment Company of America (MUTF: AIVSX ), and it has returned almost 12% since 1934. I, however, am one of many who have said he needs to stop saying 12%, especially since ICA has only averaged 9.15% since 2003. Since the market has historically returned 9% since 1871, that is a more reasonable target number. This is according to data from Nobel Laureate Robert Shiller. If one is willing to listen, there are strategies that will help one achieve 12%, or at least beat the market; the strategy described here is one of many. Frederik Vanhaverbeke describes how no less than 30 Wall Street Legends consistently beat the market. Again, it is a matter time and effort. Which equities are in the Hybrid portfolio now? Here are the top five: Symbol Name SHOO Steve Madden Ltd GOLD Randgold Resources WDR Waddell & Reed Financial CRUS Cirrus Logic SLW Silver Wheaton Why is this topic important? It’s important because the naysayers contend that one cannot beat the market, and just give up. They acquiesce and only use index funds. One can beat the market, but that only occurs if one is willing to put in the work. Happy investing. Editor’s Note: This article covers one or more stocks trading at less than $1 per share and/or with less than a $100 million market cap. Please be aware of the risks associated with these stocks.
Learning From Children About Investing

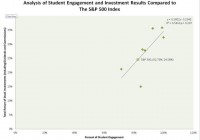
From the mouths of babes. Students show that one can beat the market, if s/he is interested. If you are passive, then invest in passive funds. If you are engaged, do it yourself or invest in managed funds. It was a simple enough project; teaching students to find a stock in which they might invest real money. That was the objective I had set when I was teaching at a high school in southwest Florida in 2013. I was assigned a class called, “Advanced Algebra with Financial Applications,” for seven periods. My goal? To teach high school seniors applied algebra for financial applications. I am on hiatus from the financial world, and wanted to return to teaching. With that, the school’s administration felt that having someone with a Series 7 and Series 66 talking to the kids on a daily basis about financial matters was an opportunity. Given that I am a stock jockey at heart, I was eager to show the students some basic stock analysis. I told them to invest in companies they knew. I showed them basic fundamental screening, so they could limit their choices to financially sound companies, actually had profits, and that those profits were likely to increase over time. Out of the approximately 190 students, 81 stocks were chosen. It was clear the students focused on products they bought or retailers where they shopped. The top five companies where the students wanted to invest were: Apple (NASDAQ: AAPL ), Disney (NYSE: DIS ), Coca-Cola (NYSE: KO ), Nike (NYSE: NKE ), and Procter & Gamble (NYSE: PG ). There were some surprising selections, and that was good, because I wanted the students to be creative, and try to find hidden gems. Companies such as Allegiant Travel (NASDAQ: ALGT ), Randgold (NASDAQ: GOLD ), L Brands (NYSE: LB ), Toyota Motors (NASDAQ: TM ), and V.F. Corp (NYSE: VFC ) made it to the ledger. We would monitor the progress of the stocks, and use current events to discuss any sharp moves in the stock prices throughout the year. Of course, this was a great opportunity to learn mathematics. Sadly, the Florida Department of Education daggered the program, and I had to transfer to another school. During the interim, I never gave the project much thought. Recently though, and ironically on the 500th day after we started, I went back to see how the portfolios were performing, and I found something very interesting. The classes that were fully engaged in the process, and who seemed to take the project seriously outperformed the S&P 500 market index. Most outperformed by a mile. It is worth describing what one means by “fully engaged.” High school students, being that they are still children, do not always do what they are supposed to do. Some of the classes had students simply not participate, and sadly, those students did not pass the class. I was not surprised by this, because this class of was being used for those students who historically struggled with mathematics, and had a history of failure. Keeping that in mind, I noticed that the classes where they fully invested their portfolios saw their stock positions outperform the market. I have a chart here to show what I mean. (click to enlarge) Essentially what happened was this: the classes with highest levels of participation saw their stock selections outperform the market. The correlation between participation and market performance was r = .7357 ( ρ = 0.0297). All of the classes where at least 85% of the students actively participated in the project outperformed the market index. The data showed that the bright line between outperformance and underperformance was an 82.75% level of participation. The data also showed when there was at least a 90% level of participation; the classes outperformed the market by at least 7.86%. Why did this happen? I did not count the students who refused to invest, so I only looked at those students who were participating. The non participating students had no effect on the outcomes directly. I guess I will say the usual disclaimer that more research will need to occur, but I am willing to make some educated guesses as to what happened. Given that this only studies seven classes, and 190 students, that is a fair conclusion to make. First, in the classes where there was full participation, there was a healthy competitive environment. One of the outperforming classes had a lot of football players in it, and they wanted to beat each other. Second, the outperforming classes had a higher level of collaboration, where the students would help each other in making decisions, and calculations for their stock selections. Of course, these observations are anecdotal, and will need to be measured in the future to determine whether anything significant exists. What this does tell me, is there might be some useful data for mutual fund companies to note. Mutual funds should have a team of analysts that have an environment of collaboration where the team members can support each other. Additionally, though, there should be a competitive environment where the stakeholders not just try to outperform the market, but try to outperform each other. For the individual investor, there are two clear conclusions. First, if one is willing to be fully engaged and active in their stock selections, then it is possible to outperform the market. There is a whole roster of superstar portfolio managers who can prove this point. If the individual investor does not have the time to dedicate to the process of finding fundamentally sound companies that will outperform over time, then hire a professional who will. Second, if one simply has a passive interest in investing, and merely does so to save for retirement or another goal, then passive indexing is just the thing to do. I hope this is useful for someone, and I will wish you happy investing. Additional disclosure: While I still have a Series 7 and Series 66, I am in no way publishing this as financial advice. If you need advice, I suggest you hire a professional. If you invest on your own, the decisions you make are yours, and so are the results.

GDX – The Way To Play Gold In 2015

Summary I anticipate gold will stabilize and turn higher during 2015. Over the near-term, the factors weighing against gold remain capable of hampering its price appreciation. I would avoid the risk inherent in owning individual miners, save for the most stable, and instead seek the leverage of the miners through GDX. Gold’s great fall of the past two years has been well-documented, and many experts see good enough reason for it to continue a while longer. However, I see the dynamics around the price of gold shifting. Given the greater swing lower of gold miners versus the price of gold, they may be priced right to benefit in a greater way from a turn in trend. Many of the miners are small and some are over-levered and vulnerable to further decline in the price of the commodity. So for the wherewithal to survive any further downswing while still availing capital to benefit from an upward move in gold, I suggest investors consider the Market Vectors Gold Miners ETF (NYSE: GDX ) here. I think that it’s one of the best ways to play for a turn in gold. Gold Past and Present I just published my expectations for gold in 2015 in a report formally marking my change in opinion about its direction. It is required reading for those studying this report, but I am summarizing it again here for those of you who might not get a chance to look at it. Then we can move forward to why I believe the Market Vectors Gold Miners ETF is a prime way to play gold in 2015. Gold prices came down significantly in 2013 and 2014, and gold relative securities followed. I believe it is popular opinion now that anticipation about the change in Federal Reserve monetary policy from expansionary to hawkish is what drove the start of the decline in gold prices in 2013. 2014 proved to be choppy for reasons discussed in my outlook report, but gold finally also found ultimate direction lower in 2014 as well. The key catalyst for that decline was the strengthening dollar, which anticipated and reacted to Fed action to halt quantitative easing. The dollar remains strong against relatively weaker currencies globally due to American economic strength and Fed monetary direction versus economic difficulties in Europe, Japan and elsewhere, and dovish central bank policy at the Bank of Japan (BOJ) and European Central Bank (ECB). To start 2015, and beginning already, I see capital flows out of better performing securities finding gold as investors seek to guard wealth again from the tides of tax relative flows. Before long, I expect a new question to be raised about the status of the dollar as a safe haven for wealth. Despite strong economic growth in the U.S. and relatively weaker activity overseas, I see geopolitical conflict somehow infecting our shores, and possibly our economy and currency in 2015. That risk alone already has sovereigns flirting with moves toward a gold standard. Some are making the change out of necessity, like Russia and Iran, but others will do so out of preference. I see this as a prelude to a future trend. The key catalyst for the dollar is likely tiring at this point. I believe the dollar has already greatly priced in the start of Fed rate hikes coming in 2015. So, a sell the news type of scenario could play out with the dollar shedding value and gold and other commodities seeing renewed price strength in 2015, especially if the dollar’s safe haven status is placed into question as I expect. Please read my report for more detail on my view for gold. Gold Miners Decline and Position Gold Relative Securities YTD SPDR Gold Trust ETF (NYSE: GLD ) -4.4% iShares Silver Trust ETF (NYSE: SLV ) -19.4% Market Vectors Gold Miners -15.4% Goldcorp (NYSE: GG ) -17.9% Newmont Mining (NYSE: NEM ) -21.7% Barrick Gold (NYSE: ABX ) -42.3% Kinross Gold (NYSE: KGC ) -39.7% Randgold Resources (NASDAQ: GOLD ) +0.4% Yamana Gold (NYSE: AUY ) -55.4% You can see how gold miners have exaggerated the price decline of gold in the comparison of the miners’ performance to the SPDR Gold Trust ETF, which tracks the price of gold. The miners are off by a significantly greater margin this year-to-date; the miner-encompassing Market Vectors Gold Miners ETF is down 15.4% versus the 4.4% slide in the GLD this year. However, the declines of most of the individual gold miners’ shares have been far greater. Even the industry leaders are off by a greater margin than the GDX. This illustrates how levered the gold miners are to the price of gold, both individually and as a group, but it also shows how risk can be reduced by using the GDX versus individual miners. Why GDX Over Miners Yamana Gold is down more than 55% this year, versus the 15.4% drop of the GDX. That’s because Yamana has 29X more debt than equity, and threshold where it becomes unfeasible for it to produce gold. It’s thereby vulnerable to swings in the price of gold and bears company specific liquidity and solvency risk. This would be the case across a swath of miners, and individual exploration and production results could disappoint as well. However the Market Vectors Gold Miners ETF allows the investor to eliminate company specific risk, or at least minimize it. The ETF seeks to match the performance of the NYSE Arca Gold Miners Index. While the GDX may hold the shares of small cap miners, its holdings are part of a diversified portfolio of firms within the mining industry. Therefore, if one miner goes bankrupt or produces poor results, the GDX will not see much price impact. It allows investors to bet on the leverage inherent in gold miners to the price of gold but to reduce the risk that exists in holding one company. Similarly to the year-to-date performance shown in the table above, the five-year charts of the GLD and the GDX show that gold miners have exaggerated the move downward in gold. I believe this reflects a sort of inverse bubble in the miners, where downside has been overdone and the shares are oversold. If we were to put the two charts together, we would see that a wide gap has opened between the struggling GDX and the valuation of the GLD. I expect it to close that gap once gold prices begin a sustainable move higher. Given my view that gold prices will stabilize and begin to move higher in the coming year, I favor long-term investment in gold relative securities. As there remain risks to the price of gold, I would refrain from investment in individual gold miners due to company specific risks, save for the largest and most stable of the firms. Instead, I suggest the Market Vectors Gold Miners security as the way to best lever the turn in gold I see, without bearing the risks inherent to individual miners.