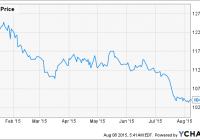
Summary All the three major labor unions in the South African gold mining industry rejected the proposed 13% pay hike. The labor unions demand 70%-100% increase of wages. The South African gold producers can’t afford to increase wages too much as labor costs are said to represent approximately 50% of gold mining costs in South Africa. A probable strike may help to support gold and GLD prices; however, it won’t push too them much higher, as the South African gold production isn’t important enough. As the gold price stabilizes in the tight range between $1,080 and $1,100 per troy ounce (toz), the SPDR Gold Trust ETF (NYSEARCA: GLD ) found its short term support at the $104 level. Although the long-term fundamentals are positive, the short-term development of the GLD share price is questionable. But the current developments in South Africa indicate that GLD may bounce off the recent lows. On August 2 , The Association of Mineworkers and Construction Union that represents approximately one third of South African gold miners, rejected a 13% pay hike proposal. On August 7 , the National Union of Mineworkers did the same. Although the offer has been increased to a 17% pay hike, the unions demand an increase by 70-100%. Basic monthly wage is approximately $460 right now which really isn’t too much, given the harsh working conditions in South African gold mines. On the other hand wage costs are said to represent approximately 50% of gold mining costs in South Africa. This claim is supported by a 2011 estimate that labour costs account for 38% of total operating expenditures. It means that increasing wages by the rejected 13% or 17% would be extremely painful for gold producers given the current gold price. Increasing wages by 100% would ruin them. The South African gold producers can’t afford to increase wages too much. The discussions should continue on Wednesday but the difference between the demands of the miners and offers of the mining companies is still very large. The general secretary of the National Union of Mineworkers claimed that they will go on strike if their demands are not met. The situation will most probably escalate in the coming weeks, however impacts of the possible strike on gold and GLD prices is questionable. South Africa And Gold Mining Although South Africa was the world’s biggest gold producer for the better part of the 20th century, its position has deteriorated significantly lately. According to the USGS data, South Africa produced approximately 150 tonnes gold in 2014. It equals to approximately 4.823 million toz. On the other hand China, the world’s biggest gold producer, mined 450 tonnes (14.468 million toz) gold and the total global gold production amounted 2,860 tonnes (91.951 million toz). It means that South Africa was the 5th biggest gold producer in 2014 (the 5th position is shared with Peru) and only 5.24% of the 2014 global gold production was attributable to this country. (click to enlarge) Source: own processing, using data of USGS Only 20 years ago, South Africa was the world’s biggest gold producer by far. It produced 580 tonnes (18.647 million toz) gold in 1994, which represented more than 25% of the global production. But poor infrastructure, labor problems and the fact that the miners must dig for gold deeper and deeper, resulted in a continuous decline of South African gold production. The South African gold production declined by 74% between 1994 and 2014, while the global gold production increased by 24% during the same time period. (click to enlarge) Source: own processing, using data of USGS The problems of the South African gold industry are well illustrated by the fact that 8 out of the 10 deepest mines are located in South Africa (chart below) and all of them produce gold. The world’s deepest mine, Mponeng , is owned by AngloGold Ashanti, which produces 405,000 toz gold per year and the operating depth ranged from 2,400 to 3,900 meters below surface in 2012. The mine life should be expanded to 2040 which means that the miners will probably dig much deeper. Source: own processing, using data of mining-technology.com Can the strike alone push GLD price higher? The strike alone probably won’t be enough to push gold and GLD price too much higher. South Africa is responsible for only slightly more than 5% of global gold production. In the case that all of the South African gold production would stop (which is not probable), global gold market would lost only slightly more than 0.4% of annual mine supply every month. And there is another problem. There was a major strike of the platinum miners last year in South Africa. The strike took place from January to June and some of the world’s biggest platinum producers (Lonmin ( OTCPK:LNMIY ), AngloAmerican Platinum ( OTCPK:AGPPY ), Impala Platinum ( OTCQX:IMPUY )) were affected. But the platinum price was relatively stable. The chart below shows price development of ETFS Physical Platinum Shares ETF (NYSEARCA: PPLT ), ETFS Physical Palladium SHares ETF (NYSEARCA: PALL ), GLD and iShares Silver Trust ETF (NYSEARCA: SLV ). Share prices of all of the funds increased by 5-9% during the first half of 2014. Only palladium price increased more significantly, mainly due to the problems between Ukraine and Russia that is the world’s biggest palladium producer. Platinum and PPLT prices increased by less than 10% although South Africa is world’s biggest platinum producer and it was responsible for 72% of global platinum production in 2013, the year before the strike. The reason is that platinum producers were processing the stockpiled material. If the South African gold miners have stockpiles large enough, a similar scenario may repeat itself this time again. It means that the strike alone doesn’t have the potential to push gold price notably higher, however it may have a positive psychological effect and it may help gold and GLD prices to hold above the current support levels. Conclusion All in all, the possible strike of the South African gold miners doesn’t have the potential to move gold and GLD prices significantly. South Africa is not that important gold producer anymore. Moreover the miners have probably some stockpiled material that may help to offset the impacts of the strike for some time. On the other if there is a strike, it may have a positive psychological impact on markets and given that GLD price is consolidating above the $104 level and most of the gold producers are unable to generate any profit at current gold prices, it may help to avoid further price declines in the short term. Disclosure: I/we have no positions in any stocks mentioned, and no plans to initiate any positions within the next 72 hours. (More…) I wrote this article myself, and it expresses my own opinions. I am not receiving compensation for it (other than from Seeking Alpha). I have no business relationship with any company whose stock is mentioned in this article.

