Tag Archives: german

A Word Of Caution About New Purchases In The Utility Sector

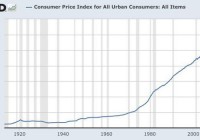
My first purchase of an electric utility stock was 400 shares of Duke Energy (NYSE: DUK ) around 1978. Somewhere along the way, I sold those shares for reasons that I no longer recall. I am not expressing a word of caution about the long term benefits that have flowed through buying and holding quality utility stocks and reinvesting the dividends. The ten year annualized total return numbers for a number of electric utility stocks are superior to the 7.83% annualized total return of the S&P 500 ETF (NYSEARCA: SPY ) through 2/13/15. Some examples include the ten year annualized performance numbers of American Electric Power (NYSE: AEP ), Dominion Resources (NYSE: D ), Edison International (NYSE: EIX ), NextEra Energy (NYSE: NEE ) and Wisconsin Energy (NYSE: WEC ) Ten Year Annualized Total Returns Through 2/13/15 Computed by Morningstar: AEP +8.09% D + 9.93% EIX + 8.72% NEE +12.15% WEC +13.03% Several other well known “utility” stocks have come close to matching the S & P 500 ten year annualized total return without the same decree of drama. AT&T +7.69% SCANA +6.86% Southern Co +6.75% Verizon Communications +7.54% The question that I am addressing now is whether new buys can be justified based on current yields and valuations. I started to look at this question a few days ago when making a comment here at SA about the impact of rising rates on REIT and utility stocks. Both of those industry sectors have attracted a large number of investors searching for yield. For many investors, REITs and utility stocks are viewed as “bond substitutes”. I started an analysis simply be looking at the current yield of the Utilities Select Sector SPDR ETF (NYSEARCA: XLU ), a low cost sector fund that owns primarily electric utility stocks. Yield: As of 2/12/15, the sponsor calculated the dividend yield at 3.28%. The attractiveness of that yield will depend on an investor’s view about the direction of interest rates. Notwithstanding the abundance of contradictory evidence, the Bond Ghouls have been predicting that a Japan Scenario will envelope the U.S. until the end of days, a slight exaggeration, based on the pricing of a thirty year treasury bond at a record low 2.25% yield recently. If an investor believes that deflation will alternate with periods of abnormally low inflation for the next 30 years, then the pricing of several long term sovereign bonds may at least appear to be rational rather than delusional. The current yields of a U.S. electric utility stock, with modest earnings and dividend growth, may even look good compared to those yields and the dire future predicted by those sovereign bond yields (U.S., Germany, Switzerland, Netherlands, Japan, etc.) The 30 year German government bond closed last Friday at a .92% yield. German Government Bonds – Bloomberg The average annual inflation rate in Germany between 1950-2015 was 2.46%. Just assume for a moment that the future will be similar to the past, with some hot and low inflation numbers and possibly a brief period of slight deflation. The .92% 30 year German government bond would produce a 1.54% negative annualized real rate of return before taxes. The average annual U.S. inflation rate between 1914-2015 was 3.32%. When the 30 year treasury hit a 2.25% earlier this year, and assuming the historical average annual rate of inflation, the total annualized return before taxes would be -1.07%. The first item for investors to consider is why are so many predicting the Japan Scenario given the recent U.S. economic numbers and the non-existence of a single annual deflation number since 1955 other than the understandable -.4% reported for 2009. Consumer Price Index, 1913- | Federal Reserve Bank of Minneapolis When looking a long term charts, it is hard to see the underlying support for what the Bond Ghouls are saying about the future. (click to enlarge) (click to enlarge) (click to enlarge) The DSR ratio highlights that U.S. households have more disposable income after debt service payments to pay down debt, to spend, or to save. I view this chart as bullish long term for stocks but not far bonds. I have been making the same point here at SA for over three years now without convincing a single bear of my point. An example of banging my head against the wall was a series of comments to this SA article published in February 2013: Sorry Bulls, But This Is Still A Secular Bear Market-Seeking Alpha It is interesting to go back and read some of those comments from other investors. Yes, I am referring to the bears here who were predicting a bear market starting in 2012 just before the S & P 500 took off on a 700 points move up, not down by the way. (click to enlarge) (click to enlarge) (click to enlarge) (click to enlarge) (click to enlarge) Links to some other relevant charts: Financial Stress-St. Louis Fed Household Financial Obligations as a percent of Disposable Personal Income-St. Louis Fed Mortgage Debt Service Payments as a Percent of Disposable Personal Income-St. Louis Fed Charge-Off Rate On All Loans, All Commercial Banks-St. Louis Fed Retail Sales: Total (Excluding Food Services)-St. Louis Fed E-Commerce Retail Sales-St. Louis Fed Light Weight Vehicle Sales: Autos & Light Trucks- St. Louis Fed Corporate Net Cash Flow with IVA -St. Louis Fed ISM Non-manufacturing-St. Louis Fed And what are the current economic statistics (not the ones generated through reality creations) that support the long term Japan Scenario prediction that underlies current intermediate and long term bond prices? I will just drag and drop here my recent discussions of this data. Is that dire long term U.S. inflation and growth forecasts embedded in those historically abnormal yields justified by the 5% real Gross Domestic Product growth in the 3rd quarter perhaps slowing to 3% in the 2014 4th quarter with personal consumption expenditures accelerating; the lowest readings on record in the debt service payments to disposable income ratio (DSR) ; the decline in the unemployment rate to 5.7% with 257,000 jobs added in January with a 12 cent rise in average hourly earnings and a 147,000 upward revision for the prior two months; a decline in the 4-week moving of initial unemployment claims to the historical lows over the past four decades; the long term forecasts of benign inflation; a temporary decline in inflation caused by a precipitous drop in a commodity’s price, the consistent and long term movement in the ISM PMI indexes in expansion territory; capacity utilization returning to its long term average where business investment has traditionally increased by 8% , or perhaps some other “negative” data set. That kind of data has to be negative rather than positive, right? Even the government’s annual inflation numbers for 2014 showed a + 3.4% increase in food prices; a 2.4% increase in medical service costs, a 2.9% increase in shelter expenses, and a 4.8% increase in medical commodities. The BLS called the rise in food prices “a substantial increase” over the 1.1% rate for 2013. While I am not predicting here a return to $80+ crude, the price may have already bottomed and the disinflationary impact created by the 50%+ decline is consequently a temporary abnormality that will self correct with supply and demand moving back into balance. Consumer Price Index Summary While it is too early to know whether intermediate and long term rates have started to turn back up, the recent movement is certainly cautionary and resembles the lift off in interest rates that started in May 2013, when the ten year was at a 1.68% yield, and culminated in a rate spike to 3.04% for that note by year end. 7 to 30 Year Treasury Yields 2/2/15 to 2/13/15 Daily Treasury Yield Curve Rates When looking at that table, it is important to keep in mind that a ten year treasury yield of 2.00% is abnormally low by historical standards since 1962: (click to enlarge) 10-Year Treasury Constant Maturity Rate – FRED – St. Louis Fed And this brings me to my word of caution about utility stocks. A 3% dividend yield is not too hot using history as a guideline. To be justified, the investor will have to buy into most of the Bond Ghouls Japan Scenario unfolding in the U.S. rather than a gradual return to something close to normal inflation and GDP growth. Valuation: For me, valuation is the kicker. What S & P sector currently has the highest P.E.G. ratio? Back in the late 1990s, I would have said technology stocks without looking to verify the answer. I said utility stocks now and I took the time to verify that response. An investor can download the current E.P.S. estimates for the S & P 500 and the various sectors from S & P in the XLS format. I can not link the document here, but anyone interested can find it using the exact google search phrase “XLS S & P Dow Jones Indices”. It should be the first result. As of 2/12/15, the estimated forward 5 year estimated P.E.G. for the utility sector is a stunningly high 3.65, and this sector has traditionally been one of the slowest growing sectors. Technology is at a 1.27 P.E.G. The P/E based on estimated 2015 earnings is 17.12. The data given by the sponsor of XLU immediately set off alarm bells when I looked at it recently. In addition to the vulnerability of stock prices due to a rising interest rate environment, the sponsor calculated the forward P/E at 17.14, which is normally a non-GAAP ex-items number, a 7.23 multiple to cash flow, and a projected 3 to 5 year estimated E.P.S. growth rate of only 4.86%, or a similar P.E.G. to one calculated by S & P and mentioned above. The Vanguard Utilities ETF (NYSEARCA: VPU ) has another set of data that is even more concerning than the XLU valuation information: As of 1/31/15, this fund owned 78 stocks, with a P/E of 20.8 times and a 2% growth rate. Portfolio & Management Taking into consideration the possible or even probable rise in rates, the low starting yields for utility stock purchases now, the high P/E and abnormally high P.E.G. ratio, I am just saying be careful out there. I will be discussing in my next blog a reduction in my position in the Duff & Phelps Global Utility Income Fund Inc. (NYSE: DPG ), a closed end fund that has performed well for me since my purchases. I may not start writing that blog until Monday after taking the time to write this one in my usual stream of consciousness writing mode. CEFConnect Page for DPG According to Morningstar, the Utilities Select Sector ETF ( XLU ) had a 2014 total return based on price of 28.73%, much better than SPY, and was up YTD 2.33% through 1/31/15. The tide has turned with the recent rise in rates since the end of last month. The total return for XLU is now at -4.34% YTD through 2/12/15. Just as a reminder, I only have cash accounts and consequently do not short stocks. I do not borrow money to buy anything. I have never bought an option or a futures contract. I am not paid anything to write these SA Instablogs or SA articles or any of my almost 2000 blogs written since early October 2008, mostly very long ones, published at Stocks, Bonds & Politics . I do not own any of those short ETFs. I am currently substantially underweighted in the Utility sector.
ETF Allocation When Stocks Are Stuck In A Moment

The long-term CAPE average is 16.5. Today’s CAPE is north of 27. CAPE ratios above 27 have only occurred in the months around 1929, 1999 and 2007. I believe that we are closer to the next “common sense” recession than we are to extraordinary acceleration of the U.S economy. The cyclically-adjusted price-to-earnings ratio (a.k.a CAPE, P/E10, Shiller’s P/E) evaluates the average inflation-adjusted earnings for the S&P 500 over the previous 10 years. The long-term CAPE average is 16.5. Today’s CAPE is north of 27. And despite numerous detractors on its predictive value, P/E10 led directly to a Nobel Prize for its creator, Robert Shiller. With 140 years of market data, CAPE ratios above 27 have only occurred in the months around 1929, 1999 and 2007. Equally worthy of note, the Nobel economist’s work accurately identified the bursting of the dot-com bubble (1999-2000) as well as the collapse of the financial system (2007-2008). Unfortunately for those who might like to argue why Shiller’s valuation methodology is irrelevant in 2015, U.S. stock prices are expensive whether you compare them to trailing 12 month earnings, forward 12 month earnings (being revised in light of the energy sector), book value and cash flow. Granted, one can suggest that zero percent rate policy makes Shiller’s P/E impotent; heck, those ridiculously low yields across the curve may make every traditional valuation metric worthless. Still, the more probable set of circumstances is that a bear market in equities is not too far off and that traditional valuation still has at least a single seat at the NYSE. Indeed, if global interest rates continue to decline, strong corporations may do the same thing that they have been doing for the past six years; that is, they may issue low rate investment grade debt and use the funds to repurchase shares of corporate stock. That activity boosts the “E” in company earnings. I still believe this activity will keep equities from dropping off a cliff in the shorter-term. If nothing else, it is largely responsible for keeping the heralded index range-bound for the better part of the last 10 weeks. Looked at another way, why would CEOs commit capital to major projects or human resources right now? The strong dollar is killing exports, weaker foreign currencies are hurting profits, global deflation is hindering sales and volatile oil prices are increasing geopolitical risks. The “go-to” move of share buybacks may very well be the primary driver that keeps the S&P 500 from falling out of bed. We should be cognizant, however, that stock buybacks for the S&P 500 are already approaching the record highs set in mid-2007. Is that a good thing? Or does it merely mask the declining sales and increasing debt of the companies that engage in the practice for too long? On the other side of the coin is the reality that bear markets are inevitable. So I decided to conduct a little exercise. What if the S&P 500 fell an average bear market percentage drop from its 2093 perch? If you split the difference between the average bearish descent since 1926 (35%) and the median plunge since 1871 (38%), the S&P 500 would bottom out near 1330. Let’s take that prospect a step further. The total return for the SPDR S&P 500 Trust ETF (NYSEARCA: SPY ) with dividends reinvested would come in around 17.5% for the first 14-plus years of the 21st century, representing an approximate compounded return of 1.2%. Of course, this would only occur if you had bought-n-held-hoped through all of the downturns – 2000-2002, 2007-2009, 2011, 2015. It gets worse. A 17.5% total return (1.2% compounded) looks even meeker up against an investment grade bond fund like PIMCO Total Return Fund (MUTF: PTTDX ). Assuming an absence of safe haven buying in the hypothetical bearish downturn and using just the performance numbers to date, the fund’s 160% since December 31, 1999 represents 7% annualized. That is for investment grade bonds, folks. “But Gary,” you protest. “You’re speaking in hypothetical scenarios. The return for SPY so far is actually 4.5% at a total return of 85%.” Fair enough. My questions to dismiss the thought process, then, are: (1) Do you believe that bear markets have been removed from the stock investing landscape and, (2) If you do believe in 30%-plus erosion of capital, what is your plan to minimize the damage? The way that I see it, central banks cannot eliminate the inevitability of recessions or bear markets. Moreover, I believe that we are closer to the next “common sense” recession than we are to extraordinary acceleration of the U.S economy. It follows that I have to prepare for the high likelihood of changes ahead. In an investing environment that – by most measures – is becoming increasingly fearful, I emphasize ETF assets on the far left and far right of the risk spectrum . On the right, I will maintain an allegiance to funds like the iShares MSCI USA Minimum Volatility ETF (NYSEARCA: USMV ), the Vanguard High Dividend Yield ETF (NYSEARCA: VYM ) and the Health Care Select Sect SPDR ETF (NYSEARCA: XLV ). They have given me little reason to cut back in that arena. I have even added a modest amount of stock risk to European exporters that might benefit from euro weakness via the iShares Currency Hedged MSCI Germany ETF (NYSEARCA: HEWG ). On the left, I remain dedicated to risk averse assets as I have throughout the prior 14 months. Long duration treasuries have provided remarkable relative value in a world where inferior country debt offers less yield than U.S. debt. I continue to be long ETFs like the Vanguard Extended Duration Treasury ETF (NYSEARCA: EDV ) and the iShares 20+ Year Treasury Bond ETF (NYSEARCA: TLT ). Taxable accounts have a variety of muni possibilities from the iShares National AMT-Free Muni Bond ETF (NYSEARCA: MUB ) to the BlackRock MuniAssets Fund (NYSE: MUA ). Perhaps most importantly, if a stock bear should be around the bend, I am able to use the FTSE Custom Multi-Asset Stock Hedge Index to my advantage. Not only did I join FTSE-Russell in creating the index that many are calling “MASH,” but I recognize the necessity of owning a diverse group of asset types to hedge against an extreme downturn in stocks. Long-dated treasuries, munis, gold, the Swiss Franc, the yen, the dollar, JGBs, German bunds, TIPS and zero coupons figure prominently in the index. Nobody knows when a bear market will emerge. Yet failing to prepare for a catastrophic decline is the worst mistake an investor can make. If nothing else, investors should recognize that the collapse in commodities, never-before-seen lows in global yields and the rapid appreciation of the almighty buck are more indicative of “risk-off” money movement than “risk-on” excitement. Disclosure: Gary Gordon, MS, CFP is the president of Pacific Park Financial, Inc., a Registered Investment Adviser with the SEC. Gary Gordon, Pacific Park Financial, Inc, and/or its clients may hold positions in the ETFs, mutual funds, and/or any investment asset mentioned above. The commentary does not constitute individualized investment advice. The opinions offered herein are not personalized recommendations to buy, sell or hold securities. At times, issuers of exchange-traded products compensate Pacific Park Financial, Inc. or its subsidiaries for advertising at the ETF Expert web site. ETF Expert content is created independently of any advertising relationships.

Are Some Decisions To Allocate To U.S. Equities Due To Survivorship Bias?

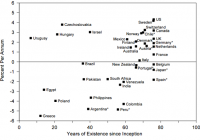
By David Foulke The CFA Institute Magazine recently published an interview (a copy is here ) with C. Thomas Howard, CEO of Athena Investment Services. Howard has some pretty explicit views on why investors should allocate all of their assets to U.S. stocks: The primary driver of long-horizon wealth is expected returns. Why would you invest in anything but stocks? Why isn’t your portfolio 100% stocks? Do you believe stocks are going to have the highest return? By the way, stocks have averaged 10% a year for a long period of time. Bonds have averaged about 6%. The difference between a portfolio that’s 100% stocks and one that is a mixture of stocks and one that is a mixture of stocks and bonds over long periods of time is huge, possibly millions of dollars. Why would I want to buy anything but the highest expected return, asset-wise? U.S. stocks have offered the best returns for a long time, and therefore the U.S. stock market is where you want to be invested. This is an interesting argument. Certainly, Howard is right that the U.S. stock market has been the best place to be invested. For instance, Mehra and Prescott in their 1985 paper, “The Equity Premium Puzzle” (a copy can be found here ), demonstrated how the risk premium on U.S. Equities from 1889-1978 averaged roughly 6%. The paper was notable in that it suggested that existing general equilibrium models were unable to explain the size of this premium, which was dramatically higher than for other economies. Academics struggled to explain the persistently strong U.S. stock market. This is the “puzzle” to which the paper’s title refers. In 1998, Reitz proposed that investors in U.S. markets might be more risk averse due to the potential occurrence of large drawdowns, or “crashes.” In a risky market that could crash dramatically, risk averse investors might expect high equity returns as compensation for bearing the risk of such crashes. Perhaps this explained high returns in the U.S. As academics pondered the effect of possible crashes on risk premia, they increasingly questioned that it was risk aversion to crashes that was driving returns. Some thought these unexplainable returns might have something to do with whether a market simply survived, which by definition meant that it consistently recovered from periodic drawdowns over long time frames. Was their some bias introduced to a market’s returns that was associated with the mere fact of its survival? In their paper, “Global Stock Markets in the Twentieth Century” (a copy can be found here ), the authors Jorion and Goetzmann explored this question. They examined 39 global stock markets from 1921 through 1996 and, as before, saw evidence of the outperformance of the U.S. stock market, which provided a real return of 4.32% over the period, the highest of all countries. During this period, however, several of these 39 markets experienced interruptions to their functioning, caused by forces such as war, political instability, hyperinflation, and so forth. The authors compared what happened when they considered both “loser” markets, and how long they were viable, in addition to the survivors, like the U.S. and others, who were “winners” over long periods. The figure below plots annual returns against the length of the history of each market: (click to enlarge) There appears to be a clear relationship between returns and longevity of markets, with longer-lived markets generating higher returns. Over the period, the median return for all 39 countries was 0.75%, representing the return earned by holding a globally diversified portfolio since 1921. Notably, there were 11 “winner” countries, which had continuous returns going back to 1921. For this group, the median return was dramatically higher, at 2.35%. Also, note that the U.S. appears at the upper right of the figure. These results suggest that returns for the U.S. 1) are uncommon at 4.3% versus 0.8% for all other countries, and 2) could be explained by survival, as could higher returns for the other survivors. If you happened to invest in a country that survived, you would have earned higher returns. The paper also examined Reitz’s hypothesis. Recall that Reitz had suggested that investors demanded a higher return as compensation for the risk of a crash. If this were true, then you would expect to see the “losers” exhibit higher equity premia. As the figure above illustrates, the opposite appears to be the case. A regression of these points would slope upward to the right. The returns of the winners may thus be conditional on their survival. If you think about investing in a particular country as like drawing a ball from an urn, then how meaningful is it to say that we can expect future returns to resemble past returns in that country, if those past returns are a result of survivor bias? Survivor bias refers to how we can focus on survivors in a data set, and ignore failures, which provide additional information about risk. Hindsight may be 20/20, but predicting the future is not, and if we condition on only the surviving winners, we ignore the possibility that we may be investing in a previous winner that may turn into a loser in the future. In a PBS interview (a copy is here ) Jack Bogle stated the following: Good markets turn to bad markets, bad markets turn to good markets. So the system is almost rigged against human psychology that says if something has done well in the past, it will do well in the future. That is not true. And it’s categorically false. And the high likelihood is when you get to somebody at his peak, he’s about to go down to the valley. The last shall be first and the first shall be last. Indeed, why should it be easy to predict which markets will survive? As Bogle points out, it may be precisely the past winners who are about to fail. Or as Jeremy Siegel stated in his paper, “The Equity Premium: Stock and Bond Returns since 1802”: Certainly investors in…1872…did not universally expect the United States to become the greatest economic power in the next century. This was not the case in many other countries. What if one had owned stock in Japanese or German firms before World War II? Or consider Argentina, which, at the turn of the century, was one of the great economic powers. It’s probably likely that Argentinian investors predicted continued economic dominance at the turn of the century. They were wrong. The outcome of World War II, which today looks obvious, could have played out in many different ways, and the U.S. might very well have turned into a loser. The Japanese certainly thought they would emerge as the dominant power after the war, or they wouldn’t have fought the war. Same for Germany. If the outcome of WW II had been different, we might today be studying the stock markets of Japan, Germany or other European countries, instead of the U.S. Who is to say the U.S. will not enter a hyperinflationary period or a sustained major war? Such an outcome for the U.S. is obviously not without precedent elsewhere. When we look at past U.S. returns, we are looking at a market that did not fail, but does it follow that it cannot fail in the future? Conditioning on past survival can subject investors to risks, which they are not accounting for. Even with strong past returns, we need to consider survivor bias, and that we are necessarily betting on a winner. Interestingly enough, Warren Buffett and Jack Bogle offer investors puzzling investment advice in the face of the results presented by Jorion and Goetzmann and a simple knowledge of survivor bias. First, Warren’s advice: Put 10% of the cash in short-term government bonds and 90% in a very low-cost S&P 500 index fund. (I suggest Vanguard’s.) Next, Jack Bogle’s advice : I wouldn’t invest outside the U.S. If someone wants to invest 20 percent or less of their portfolio outside the U.S., that’s fine. I wouldn’t do it, but if you want to, that’s fine. We have to question whether the advice from Buffett/Bogle considers the reality of survivor bias or their own personal bias. Original Post