Tag Archives: gas-utilities

Dividend Growth Stock Overview: Northwest Natural Gas Company

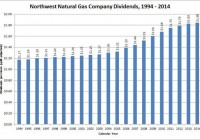
About Northwest Natural Gas Company Northwest Natural Gas Company (NYSE: NWN ) is a natural gas distribution and storage company serving over 705,000 residential, commercial and industrial customers in western Oregon and southwestern Washington. The company and its subsidiaries own and operate 31 billion cubic feet of designed storage capacity in Oregon and California. The company has been in business since 1859, and was incorporated in Oregon in 1910 and began doing business under its current name in 1997. Northwest Natural Gas is headquartered in Portland, OR and employs about 1,000 people. Northwest Natural Gas has two core business segments, the Utility Segment and the Storage Segment. The Utility Segment, which accounts for nearly all of the company’s income, runs the company’s regulated local gas distribution business, which serves over 100 cities in 18 counties with an estimated total population of 3.5 million. The segment receives about 66% of the needed gas supplies from Alberta and British Columbia provinces in Canada and the rest from the U. S. Rocky Mountain region. Segment revenues are driven by the rates determined by the regulatory authorities and by the volume of gas delivered. The volume of gas delivered is itself driven by customer growth. In 2013 and 2014, the company saw customer growth of 1.3% and 1.4%, respectively. The segment earned $2.15 per share in 2014. The Storage Segment provides gas storage services for utilities, large industrial users, electric power companies and other customers. The company signs agreements with customers of varying durations. Most service agreements range from 1-10 years, but some can last as long as 28 years. Segment revenue is driven by increased demand and, in the case of California-based storage, state renewable portfolio standards and carbon reduction targets. The segment lost a penny per share due to the reduction of revenues from the renegotiation of storage contracts that expired in 2014. In addition to the two segments noted above, the company also earned a small amount of money from the sales of appliances from the company’s store. This contributed 2 cents per share to 2014 earnings. In 2014, Northwest Natural Gas earned $58.7 million on $754.0 million of revenue. Net income was down 3% on slightly lower revenues as compared to 2013. Earnings per share were $2.16, down 3.6% from 2013. Based on this and given the annualized dividend rate of $1.86, Northwest Natural Gas has a payout ratio of 86.1%. As mentioned above, the Utility Segment saw earnings growth from customer growth and rate increases, which was offset from lower earnings from the Storage Segment. In the 1st quarter of 2015, Northwest Natural Gas earned $1.37, down from $1.40 in the same quarter in 2014. The decrease was exclusively due to a $9.1 million after-tax charge from a regulatory environmental disallowance. Northwest Natural Gas had a share repurchase program that expired in May 2015. As part of this program, 2.1 million shares had been repurchased since 2000 at a total cost of $83.3 million. The company has not announced a new share repurchase program. The company is a member of the S&P Small Cap 600 and Russell 2000 indices and trades under the ticker symbol NWN. As of mid-July, NWN stock yielded 4.2%. Northwest Natural Gas Company’s Dividend and Stock Split History (click to enlarge) Northwest Natural Gas has compounded dividends at 3.6% over the 10 years ending in 2014. With a dividend growth record that dates back to 1956, Northwest Natural Gas has one of the longest records of year-over-year dividend growth among all publicly traded companies. The company announces annual dividend increases in early October and schedules the stock to go ex-dividend at the end of October. I expect the company to announce its 60th year of dividend growth in October 2015. Like most utilities, Northwest Natural Gas generally grows its payout slowly, with year-over-year increases between 0.5% and 5.5%. From 2009-2014, the company compounded dividends at 2.89%; for the 10 and 20 years ending in 2014, the dividend growth rate is 3.56% and 2.29%, respectively. Northwest Natural Gas has split its stock once in the last 20 years – a 3-for-2 split in September 1996. Over the 5 years ending on December 31, 2014, Northwest Natural Gas stock appreciated at an annualized rate of 6.11%, from a split-adjusted $36.41 to $48.97. This significantly underperformed the 13.0% annualized return of the S&P 500 index, the 15.9% annualized return of the S&P Small Cap 600 index, and the 14.0% compounded return of the Russell 2000 Small Cap index over the same period. Northwest Natural Gas Company’s Direct Purchase and Dividend Reinvestment Plans Northwest Natural Gas has both direct purchase and dividend reinvestment plans. You do not need to be an investor in Northwest Natural Gas to participate in the plans. As a new investor, your initial investment must be at least $250. Subsequent direct investments have a minimum requirement of $25. The dividend reinvestment plan permits you to reinvest all or some of your dividends. The fee structures of the plans are favorable to investors, as Northwest Natural Gas picks up the costs of stock purchases directly from the company. (Stock purchases made on the open market are subject to brokerage commissions.) When you sell your shares, you’ll pay a transaction fee of $15 and the associated brokerage fees, which will be deducted from the sales proceeds. Helpful Links Northwest Natural Gas Company’s Investor Relations Website Current quote and financial summary for Northwest Natural Gas ( finviz.com ) Information on the direct purchase and dividend reinvestment plans for Northwest Natural Gas Disclosure: I do not currently have, nor do I plan to take positions in NWN

Chesapeake Utilities: A Big Dividend Isn’t Necessary With Earnings Growth Like This

Summary Natural gas and electric utility Chesapeake Utilities has generated impressive historical earnings growth by focusing on capital investments at the expense of dividend payouts. This strategy is set to continue driving earnings growth, as the company invests in high-demand regulated operations and its strong Florida service areas. Florida’s economic and population growth will provide long-term support for the company’s earnings, while cold winter weather in the state will help in the short term. The company’s shares are overvalued at present, but have demonstrated substantial price volatility. Potential investors are advised to watch for a dip that creates a more attractive purchase opportunity. There aren’t many names in the utilities sector that have outperformed the S&P 500 since the start of 2011 by as much as natural gas and electricity distributor Chesapeake Utilities (NYSE: CPK ). Then again, not many utilities firms have increased their annual EPS by 30% over the same period (see figure). Chesapeake has managed to achieve substantial earnings growth in a normally slow-growth sector by investing heavily in its regulated services and identifying high-margin unregulated but related areas to operate within. Historical growth rates are no guarantee of future earnings, however, and it is fair to ask whether the company will be able to continue growing at its recent pace. This article evaluates CPK as a potential long investment opportunity. CPK data by YCharts Chesapeake Utilities at a glance Chesapeake Utilities is a Delaware-based public utility that distributes natural gas, propane, and electricity in multiple service areas on the Eastern Seaboard. It conducts its operations via five regulated wholly-owned subsidiaries and four unregulated wholly-owned subsidiaries. Of the regulated subsidiaries, Chesapeake Utilities is the oldest, and it distributes natural gas to 58,000 residential, commercial, and industrial customers in Delaware and Maryland. Sandpiper Energy distributes natural gas and propane to 11,000 residential and commercial customers in Maryland. Florida Public Utilities deals with multiple types of energy resources, distributing natural gas to 73,000 residential, commercial, and industrial customers throughout the state, electricity to 31,000 customers in north Florida, and propane to 16,000 Florida customers. The subsidiary has achieved rapid customer growth over the last 15 years, as the state’s population has increased by more than 23%. Finally, the last two regulated subsidiaries, Eastern Shore Natural Gas and Peninsula Pipeline, are engaged in the transportation and delivery of natural gas – the former in Delaware, Maryland, and Pennsylvania, and the latter in Florida. The first of Chesapeake Utilities’ unregulated subsidiaries is Sharp Energy, which distributes propane to 37,000 residential, commercial, and industrial customers in Maryland and Pennsylvania. Xeron markets natural gas liquids across the U.S., while PESCO markets natural gas in Delaware, Maryland, and Florida. Grove Energy conducts CNG conversion services in Florida. Finally, Aspire Energy, which was acquired earlier this year for $52.8 million in cash and shares as Gatherco before being renamed, conducts midstream natural gas gathering, processing, transportation, and marketing services in Ohio. Chesapeake sold its IT services subsidiary BravePoint last year, and now only engages in energy and energy-related operations. The company has benefited from a combination of favorable regulatory schemes, as well as growing populations and economies in its service areas over the last several years. These advantages have enabled it to report record earnings in the last eight consecutive years, as its annual EPS has increased at an 11.6% CAGR since FY 2010. The company’s ability to generate high ROEs, with annual ROEs of 11.6% from FY 2010 to FY 2012 and 12.2% since FY 2013, has also contributed to this earnings growth. Earnings growth has in turn led to steady, if underwhelming, dividend growth of 23% (or 5.5% CAGR) since FY 2010. The dividend growth rate has sped up recently, however, achieving 6.5% in FY 2015. The current annual dividend of $1.15/share equates to a modest forward yield of 2.1% at the time of writing. While this low yield is due in part to the company’s impressive share price performance since FY 2010, it also reflects the fact that Chesapeake maintains a low dividend payout ratio (see figure). While disappointing to dividend investors, the relative lack of dividend payments has enabled the company to increase its capex by 108% over the same period. CPK Dividend Yield (TTM) data by YCharts Q1 earnings report Chesapeake Utilities reported impressive Q1 earnings back in May that beat on both lines . The company’s revenue came in at $170 million, down 8.8% YoY from $186.3 million, but beating the consensus estimate by $8.3 million. Revenue from the regulated segment increased by 7.3% versus the previous year to $109.6 million, due primarily to customer growth and an increase to its Florida rate base. The unregulated segment’s revenue fell sharply by 24% to $60.5 million, as the average price of propane during the quarter fell by 59% compared to the previous year. Lower energy prices more broadly caused the company’s cost of revenue during the quarter to fall by 20% YoY, allowing operating income to increase by 19% over the same period. The regulated segment’s operating income increased by $1.1 million, which the company attributed to the Florida rate base increase, customer growth, and the cold weather during the quarter. The unregulated segment’s operating income increased by $4.4 million, driven by the cold weather – with the average temperature being 14% colder than normal – as well as the presence of strong propane retail margins during the quarter. Retail fuel margins were strong across energy sectors, and the propane market was no different. Net income rose to $21.1 million YoY from $17.7 million (see table), resulting in EPS of $1.44 versus $1.22 the previous year, which beat the consensus by $0.28. Both the YoY increase and the beat were primarily attributable to the strong retail propane margins, which boosted EPS by $0.21. Service expansions and natural gas demand growth – the former resulting from the company’s previous capex, and the latter resulting from population growth in its service areas and the cold winter – contributed another $0.10 to EPS. Higher labor and maintenance costs offset these increases by $0.09. Chesapeake Utilities Financials (non-adjusted) Q1 2015 Q4 2014 Q3 2014 Q2 2014 Q1 2014 Revenue ($MM) 170.1 120.4 91.6 100.5 186.3 Gross income ($MM) 77.7 57.0 45.6 47.4 70.7 Net income ($MM) 21.1 10.1 3.2 5.1 17.7 Diluted EPS ($) 1.44 0.69 0.22 0.35 1.22 EBITDA ($MM) 46.3 26.9 16.2 19.3 40.0 Source: Morningstar (2015) Chesapeake Utilities announced multiple investments that were underway during Q1. First, it closed on the Gatherco acquisition – an investment that it expects to be accretive to earnings during the current fiscal year. Management stated that Gatherco was primarily limited before the acquisition by a lack of capital, and is therefore optimistic that it could, in turn, result in additional future earnings growth. The company is also constructing a 20 MW natural gas CHP system in Florida for a total cost of $40 million, and it has already started to sign long-term contracts for the facility’s outputs. Finally, the company is also investing $30 million in new natural gas transmission service infrastructure in its Mid-Atlantic service area to meet additional demand from existing customers. Outlook Chesapeake Utilities is continuing to invest heavily in both its existing infrastructure as well as new capacity. Management expects capex to rise to $223.4 million in FY 2015, compared to the annual average of $94.8 million over the previous three years. These investments will be financed via a combination of debt and equity so as to maintain the company’s existing debt-to-equity ratio. With only $16.2 million in cash on hand at the end of the quarter, this additional financing will be necessary. That said, its balance sheet has plenty of room for additional debt; the company reported $158.1 million in long-term debt and another $75.9 million in short-term debt at the end of Q1. The unemployment rates in the company’s main service areas are something of a mixed bag at present. While the rates in Delaware, Maryland, and Florida have all declined since FY 2010 (and those in the first two were never that high to begin with – see figure), Florida’s rate has lagged behind the U.S. average since last year. Delaware’s rate also increased recently for the first time since the beginning of 2013. A brighter picture is presented by economic growth in the service areas, however. GDP growth has increased in all three states since the beginning of 2013 (see second figure), while that of Florida, which is an increasingly important contributor to Chesapeake’s earnings, almost reached 5%. Furthermore, population growth in Florida shows few signs of slowing as Baby Boomers reach retirement age and move south. Very recent changes to the unemployment rate aside, then, Chesapeake’s service area economies should support continued earnings growth so long as the company continues to make the investments necessary to meet increased demand. Delaware Unemployment Rate data by YCharts Delaware Change in GDP data by YCharts Florida can also be expected to provide a short-term earnings boost this winter due to the presence of El Niño, which is expected to make its strongest appearance in the last 50 years . The event has historically been associated with much colder-than-average winter temperatures in Florida, especially during Q1 . We are talking about Florida, of course, so even very cold temperatures compared to the long-term average will result in a smaller increase to natural gas demand than even a smaller average temperature reduction in Delaware or Maryland would. Florida’s contribution to the company’s total heating degree days in recent years has not be inconsequential, however, and El Niño can be expected to have a positive impact on its earnings as a result, albeit not a major one. Valuation The analyst earnings estimates for Chesapeake Utilities in FY 2015 and FY 2016 have increased substantially in response to its better-than-expected Q1 results and continued investment in high-demand areas. The FY 2015 consensus estimate has increased from $2.54 to $2.77 over the last 90 days, while the FY 2016 estimate has increased from $2.72 to $2.82 over the same period. The achievement of both estimates would push the company’s streak of record annual earnings to ten, while also representing double-digit earnings growth. Based on a share price of $54.51 at the time of this writing, the company’s shares trade at 18.3x trailing earnings and 19.7x and 19.3x forward earnings for FY 2015 and FY 2016, respectively. These valuations are very high, both relative to other electric and natural gas utilities and the company’s own respective 5-year ranges (see figure). The company’s shares are overvalued at this time, although I would not categorize them as very overvalued due to its large future earnings growth prospects. Potential investors should note that the company’s emphasis on earnings growth rather than dividend growth has resulted in a substantial degree of share price volatility over the years, providing more opportunities to buy during a downturn than is common in the broader utilities sector. CPK PE Ratio (TTM) data by YCharts Conclusion Chesapeake Utilities has managed to achieve very impressive earnings growth over the last decade by opting to fund growth via investments in high-demand utility service areas and unregulated acquisitions, rather than distributing the majority of its net income to investors. While this focus has left it with one of the less attractive dividends in the sector, it has also enabled the company to create a virtuous earnings cycle as it continues to increase its capital expenditures in growth areas. The company’s expanding footprint in Florida will provide its earnings with both short-term support resulting from an expected cold winter, as well as long-term support due to that state’s expanding population and economy. I do not recommend that potential investors initiate long investments in Chesapeake Utilities at this time, but that’s only because its shares are overvalued relative to future earnings growth. That said, the company’s share price has a history of volatility, and potential investors should be prepared to move quickly in the event that its shares become attractively valued. A move below $45, or 16x FY 2016 earnings, would make for such an opportunity. While this wouldn’t result in undervalued shares, the company’s potential earnings growth mitigates the need for a substantial margin of safety. Disclosure: I/we have no positions in any stocks mentioned, and no plans to initiate any positions within the next 72 hours. (More…) I wrote this article myself, and it expresses my own opinions. I am not receiving compensation for it (other than from Seeking Alpha). I have no business relationship with any company whose stock is mentioned in this article.
2 Big Investments Begin To Pay Off For The Laclede Group

Summary Natural gas utility holding company, The Laclede Group, has seen two recent acquisitions pay off in the form of earnings growth following a period of stagnation. The acquisition of Alabama utility, Alagasco, has proven especially valuable due to that state’s favorable regulatory scheme and a likely colder-than-average upcoming winter there. Economic weakness in Missouri and Alabama could reduce the firm’s consolidated earnings growth, however, if it proves to be sustained. A solid dividend history aside, the company’s 3.4% forward yield is not sufficient to overcome economic weakness and high share valuations in making it an attractive investment at this time. The Laclede Group (NYSE: LG ) is a St. Louis-based public utility holding company that operates both regulated and non-regulated natural gas distribution and marketing operations via wholly-owned subsidiaries. In addition to distributing natural gas to more than 1 million customers across its subsidiaries, the company also has 48 Bcf of natural gas and propane storage capacity. The Laclede Group has been on a buying spree in recent years, purchasing in-state peer, Missouri Gas Company, in 2013 and Alabama utility, Alagasco, in 2014. Both moves required it to greatly expand its debt load and caused its earnings to decline on a non-adjusted basis. More recently the acquisitions have begun to deliver earnings growth of their own, however, and the company’s share price is well above its 52-week low (see figure), defying broader sector performance. This article evaluates The Laclede Group as a potential long investment. LG data by YCharts The Laclede Group at a glance The Laclede Group distributes natural gas to customers via three regulated subsidiary utilities. The original is Laclede Gas Co., which is the largest natural gas distribution utility in the state of Missouri with 16,000 miles of main and service lines. It has 642,000 customers in St. Louis and east Missouri as well as 30 Bcf of natural gas and propane storage capacity and a propane vaporization facility. Missouri Gas Energy, which was purchased in 2013, provides natural gas to another 500,000 customers in Kansas City and west Missouri. Finally, Alagasco (aka Alabama Gas Corp.), which is the largest natural gas utility in the state of Alabama, distributes natural gas to 419,000 customers in 200 Alabama communities. The Laclede Group also operates several unregulated subsidiaries, the largest of which is Laclede Energy Resources, which provides non-regulatory natural gas services including marketing, and Laclede Pipeline Co., which transports propane between storage facilities in Missouri and Illinois. The regulated subsidiaries generate the overwhelming majority of the parent company’s earnings, however, reaching 98% in the TTM period. Laclede Gas Co. and Missouri Gas Energy both operate under the same favorable regulatory scheme. The Laclede Group has benefited from this consistency and reported a natural gas utility adjusted EPS CAGR of 14.8% between FY 2010 and FY 2014, with the increase being mostly driven by heavy investment in natural gas infrastructure. The holding company has reported adjusted EPS growth in four of its last five fiscal years, with flat growth being reported for the fifth year. This consistent performance goes back beyond the last five years, with The Laclede Group boasting 70 consecutive years of dividend payments, although its most recent performance has enabled it to provide 12 consecutive years of dividend increases. Its most recent increase of 4.5%, which was announced last November, resulted in a quarterly dividend of $0.46, or a 3.4% forward yield at the time of writing. The company targets a dividend payout ratio of 55%-65%, a range that it has largely maintained over the last five years even as its dividend as increased by 16% over the same period (see figure). LG Payout Ratio (NYSE: TTM ) data by YCharts FQ2 earnings report The Laclede Group reported the results of its fiscal Q2 for the period ending March 31, 2015, in May. The company reported revenue of $877.4 million, up 26.3% YoY, due to the fact that the Alagasco operations appeared on the latest quarter’s income statement. The result missed the consensus estimated by $90 million , however. The strongest performers were the subsidiary utilities, with natural gas utility revenue increasing by 53.5% YoY to $847 million, or 96.4% of total consolidated revenue as a result of the Alagasco acquisition. Natural gas marketing revenue fell by 49.4% compared to the previous year $30.4, however, mainly due to the presence of normal weather (FQ2 temperatures were 10% warmer YoY on average, albeit 6% colder than the long-term average) and lower natural gas prices in the most recent FQ2 than before. Operating income also rose strongly YoY to $157.7 million from $87.2 million. While much of this gain was again due to Alagasco, operating expense only rose by 18.5% YoY to $719.7 million, or $76.5 million less of an increase than was reported for revenue. The Laclede Group reported that its legacy operating income increased by $13.9 million compared to the previous year due to the introduction of new, more favorable rates in Missouri. Consolidated net income came in at $94.4 million, up 80% YoY from $52.2 million (see table). More importantly, EPS came in at $2.18, up from $1.59 the previous year despite the issuance of 11 million common shares to help finance the Alagasco acquisitions in the interim. Adjusted net income, which excluded $1.5 million in one-time acquisition-related expenses and $1.7 million in a fair value adjustment resulting from unrealized derivative losses, rose still higher to $97.6 million from $51.7 million YoY. Adjusted EPS (or “net economic earnings” in the company’s parlance) came in at $2.25 compared to $1.58 YoY, beating the consensus estimate by $0.12. The Laclede Group Financials (non-adjusted) FQ2 2015 FQ1 2015 FQ4 2014 FQ3 2014 FQ2 2014 Revenue ($MM) 877.4 619.6 222.3 241.8 694.5 Gross income ($MM) 394.6 254.4 (59.9) 192.5 289.2 Net income ($MM) 94.4 47.1 (14.9) 11.7 52.2 Diluted EPS ($) 2.18 1.09 (0.34) 0.33 1.59 EBITDA ($MM) 43.2 43.2 43.4 35.0 32.6 Source: Morningstar (2015). The company has been investing heavily in modernizing its existing distribution pipelines, resulting in much higher capex in the previous two quarters than before. It expects its FY 2015 capex to reach $300 million, with half of this being spent on pipeline replacement, up from $170 million in FY 2014. Due to the residual effects of the aforementioned debt increase and secondary equity offering, however, The Laclede Group ended FQ2 with $46.9 million, up from $10.9 million at the end of FQ2 2014. Its current ratio fell sharply over the course of the previous four quarters from 1.29 to 0.75, however, primarily due to a $290 million increase to short-term debt. While the current ratio isn’t nearly as important to regulated utilities with their steady cash flows than non-regulated firms, this is still something for investors to keep an eye on in coming quarters. Long-term debt increased by $903.2 million YoY to $1.7 billion to fund the Alagasco acquisition. Fortunately for investors, this investment yielded a 98% operating cash flow increase YoY, yielding a result of $314 million in the most recent quarter. Furthermore, the company has maintained fairly strong credit ratings ranging from BBB+ to A by S&P, and it has $750 million in consolidated liquidity available from existing credit facilities. $1.7 billion is also not an especially large debt load for a firm of the company’s size, mitigating concerns that rising interest rates later in the year could reduce its earnings. The Laclede Group’s most recent acquisition is more than capable of servicing the large debt taken on to complete it. Outlook The Laclede Group’s management had initially provided guidance of long-term adjusted EPS growth of 4% to 6%. The company now expects to exceed this pace in FY 2015 and possibly FY 2016 on a weather-normalized basis. This earnings growth is to be maintained via $1.5 billion in total capex through FY 2019, or $300 million in annual capex, mainly in the form of distribution infrastructure investment and expansion. The Laclede Group operates under two different regulatory schemes, both of which are favorable in their own ways. Missouri employs a traditional regulatory scheme under which rate cases are filed every three years. This lack of regulatory flexibility is offset by weather-normalization mechanisms and rapid recovery mechanisms for pipeline replacements, the latter of which allows The Laclede Group to recapture infrastructure upgrade costs every six months. The company should expect to quickly see its large planned pipeline replacement costs recaptured via higher rate bases through FY 2019 as a result. Alabama employs a very flexible regulatory scheme under which rate filings are made annually on a forward basis and multiple cost recapture mechanisms are provided. While this flexibility can result in lower allowed ROEs, the state’s scheme currently provides a substantially higher allowed ROE to Alagasco (10.8%) than Missouri provides to either Laclede Gas (9.7%) or Missouri Gas (9.8%). The Laclede Group’s overall achieved ROE has been a cause for concern of late. Missouri was hit hard by the Great Recession as its unemployment rate almost reached the double-digits and the company’s consolidated ROE ultimately peaked at 11.5% in FY 2011 before steadily declining. It didn’t even reach 7% in FY 2013 and FY 2014 and, while this was in part due to one-time acquisition costs that reduced non-adjusted net income, a period of non-existent earnings growth also was responsible. The Alagasco acquisition pushed this above 10% TTM on both adjusted and non-adjusted bases, indicating the wisdom of the move despite its risks. While it would be better still to see the company’s Missouri operations achieve ROEs closer to their allowed ROEs, Alagasco is positioned to drive overall earnings growth for The Laclede Group. This is ultimately important because both Missouri and Alabama have seen their economies weaken of late. The unemployment rate in both states recently increased and are now above the U.S. average after being well below it over the previous five years (see figure). Likewise, GDP growth in both states has slackened and their economies are no longer growing as quickly as the country’s (see second figure). This is especially a concern for the firm’s Missouri operations, as earnings growth disappeared on an adjusted basis when that state’s unemployment rate stabilized. It is too early to say that earnings growth from the Missouri operations will decrease, of course, but it is a potential concern for investors. Missouri Unemployment Rate data by YCharts Missouri Change in GDP data by YCharts Weather-related factors could cause the company’s Alabama operations to be an outsized contributor to its consolidated earnings in the coming quarters due to the presence of El Niño conditions. After missing an expected appearance in 2014, the phenomenon is now expected to be one of the strongest in the last 50 years this winter. El Niño events have historically been associated with above average winter temperatures in the northern half of the U.S. and below average temperatures in the southern half. NOAA reviewed historical events back in the 1990s and determined that Missouri experiences warmer-than-average temperatures in Q4 while Alabama experiences colder-than-average temperatures in Q1 during El Niños. The fact that all of The Laclede Group’s operations reside in the southern half of the country means that even record cold in Alabama would be unlikely to result in a tremendous surge to natural gas demand there, of course (a 47 degree F winter average temp is downright balmy for those of us raised in the Midwest), but it can be expected to boost demand. Whether this increase will offset reduced demand in Missouri remains to be seen, however, and it is possible that the net effect of El Niño on the company’s winter operations is zero. Valuation Analyst estimates for The Laclede Group have increased slightly over the last 90 days in response to the company’s better-than-expected FQ2 results. The FY 2015 adjusted EPS consensus estimate has increased from $3.16 to $3.17 while the FY 2016 estimate has increased from $3.35 to $3.38. Based on its share price at the time of writing of $53.64, the company is trading at trailing P/E ratios of 16.5x and 14.6x on non-adjusted and adjusted bases, respectively, and forward ratios for FY 2015 and FY 2016 of 16.9x and 15.9x, respectively. While lower than for some firms in the gas utilities sector, these ratios are all near the top of their respective 5-year ranges (see figure). The company’s share price does not appear to be undervalued at present, although expected earnings growth in FY 2016 prevents them from being clearly overvalued either. LG PE Ratio ( TTM ) data by YCharts Conclusion Acquisitions of peers in Missouri and Alabama provided natural gas utility holding company The Laclede Group with a substantial earnings boost in Q1 following a period of stagnation. Hindsight makes the latter investment in particular look positive due to Alagasco’s especially favorable regulatory scheme and the prospect of a colder-than average Alabama 2015/2016 winter resulting from a very strong El Niño event. This advantage could be offset by signs of economic weakness in both Missouri and Alabama, although it is too early to say whether or not this development will be sustained enough to negatively impact the company’s expected earnings growth. While consistent dividend growth, favorable regulatory schemes, and large planned capex provide support for management’s earnings growth guidance, conservative investors should require a margin of safety in the form of undervalued shares to compensate for the aforementioned economic weakness and The Laclede Group’s pre-acquisitions ROE weakness. Such a margin is not available at present, however, following share price strength, especially compared to the broader gas utilities sector over the last year. I recommend that potential investors wait for the share price to fall to 14x forward earnings ($47.32 based on the current FY 2016 estimate) before reevaluating the company as a potential long investment. Disclosure: I/we have no positions in any stocks mentioned, and no plans to initiate any positions within the next 72 hours. (More…) I wrote this article myself, and it expresses my own opinions. I am not receiving compensation for it (other than from Seeking Alpha). I have no business relationship with any company whose stock is mentioned in this article.