An Extraordinary Edge You Have As A Small Investor
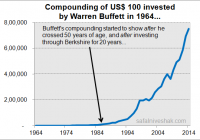
It goes without saying that capital allocation is a CEO’s most important job. How he allocates capital over the long run is what determines the value he creates for the business and its shareholders. But the reason many CEOs fail in profitably allocating capital is their incentives, which are aligned to what they can do in the next 1-2 years than what they must do in the next 7-10 years. This is also how most investors and money managers work – especially after a period of good performance, they would rather go for the kill in the next few months or maybe 1-2 years, than build portfolios that would do well over a 10+ year period. “Who wants to get rich in old age?” goes the thought process. “Why not gun for a 30-40% return and retire rich in the next 10 years?” After all, this is what simple math suggests. If you can invest Rs 5,000 per month and do that every month for 25 straight years, and at an annual rate of return of 30%, you will have almost Rs 34 crores after 25 years. On the other hand, if you earn just 20% annually, and everything else remains same, the amount in your bank after 25 years would be just Rs 4 crores. That’s a difference of a huge Rs 30 crores. Now most people would wonder, “Who would want to earn 20% and be left with just Rs 4 crores when you can go for the kill (read, 30%) and end with Rs 30 crores extra before you get old?” This is perfect reasoning, my dear friend. But, if you are not a full-time investor with a great knack of pulling out winner after winner, aiming for 30% annual return from the stock market is akin to starting your climb up Mt. Everest with a dash. Especially when you start in a bull market – and a lot of the 30-percenters of the last 4-5 years have started in the bull market – and consider that you may after all be a distant cousin of Usain Bolt, it’s easy to fall for the ‘go for the kill’ mindset. I’m sure a lot of stock market pros reading this would want to shut me up here, because they do believe they have the capabilities to earn such great returns, and sustainably. I have nothing to offer them here, but best wishes. But if you aren’t a pro, and if you are not very old, I would suggest you to take note of the only thing you can control in your investment journey – which also happens to be your biggest advantage as an individual investor in your pursuit of creating wealth from the stock market. And what’s that? It’s surely not the amount of return you want to earn, however much you try. That’s not in your control. But the only thing you are in complete control of is… Time! As an entrepreneur, here is what I count amongst the best advice I ever received on the concept of how managers can make best profitable capital allocation decisions for significant value creation. This comes from Amazon’s Jeff Bezos – If everything you do needs to work on a three-year time horizon, then you’re competing against a lot of people. But if you’re willing to invest on a seven-year time horizon, you’re now competing against a fraction of those people, because very few companies are willing to do that. Just by lengthening the time horizon, you can engage in endeavors that you could never otherwise pursue. At Amazon we like things to work in five to seven years. Note the big idea here – “Just by lengthening the time horizon, you can engage in endeavors that you could never otherwise pursue.” This is also true when you are investing in the stock market. Just by lengthening the time, you stay with good quality businesses – or businesses that remain good – you can create wealth you could have never thought of, and by the time you need that wealth. Like the CEO of a privately held company who can make decisions for the future without worrying about next quarter’s earnings, you can use time arbitrage to benefit from time-tested investment processes without the worry, and often financial damage that comes from recklessly chasing quick returns. Your Biggest Edge There are three main sources of edge you may have as an investor – Informational – What you can know that others don’t know Analytical – How you can process what is known better than others Behavioural – How sensibly you can behave as compared to others Now, it’s rare to possess all the three edges. It’s not impossible, but rare. In markets that are mostly efficient, having an informational edge is difficult. Many people are doing all they can to talk to customers, suppliers and industry experts to glean further insight into a company or an industry and profit from anomalies. And then, if you claim to possess too much of an informational edge, you run the risk of a face-off with the stock market regulator on the issue of insider information. Then, as far as analytical edge is concerned, it can be obtained through extreme smartness and hard work. Having such an edge means that even if you have the same information as everyone else, you’ll be able to process it better than others and see what the market doesn’t see. But having such an edge is also really hard, because there are a lot of very smart people motivated to analyze things better and faster than you. You will realize this if you are intellectually honest. So the high degree of analytical competition renders this edge a non-edge in the long run. Michael Mauboussin addresses this concept in his book, The Success Equation , where he writes – The key is this idea called the paradox of skill. As people become better at an activity, the difference between the best and the average and the best and the worst becomes much narrower. As people become more skillful, luck becomes more important. That’s precisely what happens in the world of investing. Anyways, that leaves the final source of edge an investor can have i.e., behavioural, or how you behave. So, while many investors may have the same information as others, or have the same analytical rigour, they behave differently. And most of how you behave is determined by how patient you are in real life and whether you have adequate time and staying power available with you. Most people are not patient when it comes to the stock market, and despite knowing the pitfalls of behaving badly. Now, when it comes to staying power, here is how Prof. Sanjay Bakshi defined it in his recent post – From the vantage point of the investor, staying power comes from: 1. Large number of years left to invest. 2. Ability to handle volatility through financial strength – low or no debt and significant disposable income preventing the need to liquidate portfolio during inappropriate times. 3. A frugal nature. 4. Ability to handle volatility through psychological strength. 5. A very long-term view about investing. 6. Structural advantages – investing your own money or other people’s money who will not or cannot withdraw it for a long long time. 7. Family support during tough times. As you can see from the list above, most factors that create staying power for you as an investor are related to how you behave. And the reason this is a great edge you have against the big, institutional investors – who otherwise may have analytical and informational edges – is that your behaviour is completely under your control as against the latter who often behave (frequently irrationally) how their clients want them to behave. If Mr. Market and its other participants are discounting things 12-15 months down the line, and if you can look out 5-10 years, you will have a time arbitrage advantage, which is a structural advantage to have. In short, as an individual, small investor, if you are… Not chasing unreasonable returns, and Invest money that you won’t need for the next 8-10 years … you are perfectly placed to benefit from time arbitrage and take opportunities handed to you by others who are… Chasing unreasonable returns and are thus more prone to making serious mistakes (if their expectations are not met), Investing borrowed money that they must return, even if the markets are bad, and Investing under an institutional setup and thus suffer from institutional compulsions like short-term incentives. How bigger and better an edge can you have? To quote Warren Buffett – The stock market is a no-called-strike game. You don’t have to swing at everything – you can wait for your pitch. The problem when you’re a money manager is that your fans keep yelling, “Swing, you bum!” That’s about swinging (buying a good quality business) when the price is right. And then you let time take over. To quote Buffett again… Time is the friend of the wonderful company, the enemy of the mediocre. Time is also your wonderful friend, dear investor. You only need to trust in it, and let its magic work. If you can spot a great value (you can learn to do that), you just need to buy it and then sit still as long as it remains good value (difficult, but very much possible). This is the single-most profitable form of investing in the world. It’s Not Easy, but Very Effective I will be honest here. Time arbitrage is not easy. A few months of a falling market or seeing your stocks going nowhere can feel like years. The impulse to “do something” can be overwhelming. Unfortunately, that impulse, more often than not, would hurt your long-term returns. Time arbitrage, on the other hand, yields tremendous financial and psychological benefits for those with the discipline to hold fast against the noise. This is an edge worth cultivating. It costs nothing but time and can be applied by anyone, including you. I would leave you with this chart of how Buffett compounded during his 50+ years at Berkshire… Note from the chart that his compounding began to show after he crossed 50 years of age, and after investing through Berkshire for 20 years. When you imagine yourself at 85, like Buffett is today, you may not see yourself come even a distant close to what he has achieved over these years. But like he did, if you can start early and keep at it, when you are 40 or 50, you would realize that you did yourself a great deed by giving your wealth time to grow, and a lot of it. If you are not dependent on investing for your living, please don’t try to go for the kill. Be bold at your work so that you earn more, save more, and thus invest more. Don’t try to act bold in the stock market. As Howards Marks said… There are old investors, and there are bold investors, but there are no old bold investors. You got the point, right?

