Tag Archives: function

JPN: A New Way To Invest In Japan

Summary Barron’s says it’s time to get long Japan. Deutsche Bank listed a new Japan ETF at the end of June. This new ETF may be an excellent way to buy Japan. On July 18th, Barron’s published an article titled, ” Time to Buy Japan’s Blue Chips .” Given that, and given that some investors may be seeking to gain exposure to Japan, I thought I would discuss and analyze one of the newest ways to get long Japan. The Deustche X-trackers Japan JPX-Nikkei 400 Equity ETF (NYSE: JPN ), freshly listed on June 24th, is Deutsche Bank’s newest Japan ETF, and the first U.S. listed ETF that tracks the JPX-Nikkei 400 Index. In this brief analysis, I will take a look at the underlying index that JPN tracks, how the fund is structured and how it compares to another Japan ETF. The Underlying Index To begin my analysis of JPN, I will first describe how the underlying JPX-Nikkei 400 Index works. This index is based on the 400 highest scoring (more on the “score” in a moment) listings from the JASDAQ and TSE. The scores are based on a four-part selection process, which begins with this screening: Listed for at least 3 years Must be common stock More assets than liabilities in the last 3 fiscal years No operating or overall deficit in the last 3 fiscal years Not designated to be de-listed After this initial screening, the top 1000 listings are selected based on market cap and trading value from the last 3 years. Those 1000 listings are then scored based on quantitative factors: 3-year average Return on Equity (40% weighting) 3-year cumulative operating profit (40%) Market capitalization (20%) Then, scoring based on qualitative factors is added where present: Appointment of independent outside directors Adoption of IFRS (International Financial Reporting Standards) Disclosure of English earnings information The top 400 listings are selected from the 1000 initially screened. I would also note that no single component makes up more than 1.5% of the index. Components JPN consists of 284 holdings. The fund is heavily weighted in industrials (20.28%), financials (18.96%), and consumer discretionary (17.08%). The top 10 holdings are as follows: KDDI Corporation ( OTCPK:KDDIY ) (Telecommunications – 1.83%) Nippon Telegraph and Telephone (NYSE: NTT ) (Telecommunications – 1.83%) Mitsubishi UFJ Financial Group (NYSE: MTU ) (Financials – 1.75%) Toyota Motor Corp (NYSE: TM ) (Consumer Goods – 1.62%) Mizuho Financial Group Inc (NYSE: MFG ) (Financials – 1.59%) FANUC LTD ( OTCPK:FANUY ) (Industrials – 1.55%) Japan Tobacco ( OTCPK:JAPAY ) (Consumer Goods – 1.54%) Mitsui Fudosan Company ( OTCPK:MTSFY ) (Financials [Real Estate] – 1.52%) SMC Corporation ( OTCPK:SMCAY ) (Industrials – 1.50%) Central Japan Railway Co. ( OTCPK:CJPRY ) (Services – 1.49%) Given that there is no major concentration in any one listing, I would say that this ETF is fairly well diversified. However, it is heavily weighted in the 3 aforementioned sectors, which make up a combined 56.32% of the portfolio. The other 43.5% of the portfolio comes from a combination of information technology, consumer staples, health care, telecommunication services, materials, utilities, energy, and “other.” The least represented sectors are utilities and energy, each at < 1%. Comparison to EWJ One of the most popular and liquid Japan ETFs is the iShares MSCI Japan ETF (NYSEARCA: EWJ ). EWJ provides "targeted access to 85% of the Japanese stock market" by tracking the MSCI Japan Index. MSCI's broad index composition methodology is based on market capitalization and liquidity. In this regard, EWJ's underlying is less selective than JPN's underlying. As a result, the MSCI Japan Index is currently up 14.36% YTD while the JPX Nikkei-400 Index is up about 17.50% YTD. EWJ has the same top 3 sector representations, although they are weighted differently. The most weighted sector in EWJ is consumer discretionary (22%), followed by financials (19.64%) and industrials (18.90%). EWJ is also arguably less diversified, with over 9% of the portfolio's value held in just two listings (Toyota Motor Corporation at 6.11% and Mitsubishi UFJ Financial Group at 3.05%). EWJ's expense ratio, at .47%, is marginally higher than JPN's, which is .40%. Just for reference, other Japan ETFs include: WisdomTree Japan Hedged Equity ETF ( DXJ) WisdomTree Japan SmallCap Dividend ETF ( DFJ) Deutsche X-trackers MSCI Japan Hedged Equity ETF ( DBJP) iShares Currency Hedged MSCI Japan ETF ( HEWJ) Conclusion My personal opinion is that JPN may offer better aimed exposure than EWJ because it tracks an underlying that adheres to a more strict selection process. However, a prospective investor should note that it is fairly illiquid right now, given that it is brand new. Furthermore, it should also be noted that there are other Japan ETFs that are currency hedged, which some may prefer depending on one's view of current macroeconomic conditions. While it is still early in the life of JPN, I think it is a fund worth further investigation if one of your goals is to be invested in quality Japanese equities. Disclosure: I/we have no positions in any stocks mentioned, and no plans to initiate any positions within the next 72 hours. (More...) I wrote this article myself, and it expresses my own opinions. I am not receiving compensation for it (other than from Seeking Alpha). I have no business relationship with any company whose stock is mentioned in this article. Additional disclosure: This article is not intended to be a recommendation to buy or sell Japanese equities. It is intended simply to break down a new product that may be useful to investors who have a long bias on the Japanese equity markets.
Frustrated Yet?

The last year has been a tough one for investors. There are a few places one could have booked a double-digit gain in the last 12 months but not many and certainly not in assets that are in the standard portfolio. Currency hedged ETFs for European and Japanese stocks produced big gains, but a lot of the gain was from nothing but currency movements. And most investors shouldn’t be trying to make their yearly return punting on currencies. Stocks for the most part have been disappointing with Nasdaq as a notable exception. Notable because a lot of the action there is reminiscent of the last time that index was leading the market back in 1999/2000. The recent big moves in Google (NASDAQ: GOOG ) (NASDAQ: GOOGL ), Netflix (NASDAQ: NFLX ) and Amazon (NASDAQ: AMZN ) – based on not much – provided a eerie sense of deja vu for anyone who lived through that giddy time. The S&P 500 over the last six months is barely positive, up about 2% (or it is as I write this Friday afternoon; but if things keep going in the current direction, that could be a lot closer to 0 by the close). The average doesn’t do justice to what is really going on though. Only about half the stocks in the S&P 500 are trading above their 200-day moving average right now. Even for an index like the Nasdaq that has performed pretty well this year, less than half the stocks in the index are still in uptrends, trading above their 200-day MA. These are capitalization weighted indexes and at least right now, size does seem to matter. A similar message is sent by the advance/decline stats which show the decliners winning by a pretty wide margin. New highs/new lows also looks less than healthy with new highs increasingly scarce. So the internals of the stock market are deteriorating notably, something that doesn’t generally bode well for the immediate future for stock prices. There are other signs of stress as well. Junk bonds essentially peaked almost a year ago in price and have been trading sideways with a downward bias which has recently accelerated. With Treasuries generally well bid all week, the spread between junk and Treasury yields widened on the week, continuing the longer-term trend that started last summer and reversing the shorter-term narrowing trend that started at the beginning of this year. Credit spreads are highly correlated with the stock market, so ignore the junk market at your portfolio’s peril. Other signs of stress have emerged over the last couple of weeks. Commodities have resumed their downtrend and unlike some other recent periods, it isn’t just a function of a rising dollar. The dollar has been fairly steady but was down last week even as gold and other commodities plumbed new lows for the move. Oil is breaking toward its lows and that is undoubtedly the source of at least some of the selling in the junk bond market. The fracking companies are still struggling and lower prices aren’t going to help them make their interest payments now that their hedges are expiring. The Treasury market also is pointing to some stress with inflation and growth expectations both falling a bit recently. The frustration of the diversified investor actually goes back quite a bit further than the last 6 months or last year. If you have been following an investment plan that includes international stocks and bonds, a smattering of commodities and/or anything else that isn’t US stocks, your personal pain is now running into more like two years and maybe a bit more. I track a long list of passive portfolios and many of the globally diversified ones are working on their third consecutive year of low-to-mid single-digit returns – assuming this year turns out to have a positive number. It isn’t just the US stock indexes that have been narrowing; it is the entire investment universe. This winnowing of the investment universe to a few winners, turning diversification into a risk factor, is just one more example of the negative consequences of the modern form of economics in which common sense has been relegated to quaint notion and nonsense elevated to learned discourse. It is an Orwellian discipline where borrowing and spending have replaced thrift and investment as the drivers of economic growth, prudence is punished, speculation celebrated and rewarded. Is it any wonder that our economy continues to struggle when we’ve spent decades urging the population to be irresponsible, to ignore the future so that our present can be more comfortable? Monetary policy is a cudgel, a blunt tool used for more than a mere nudge, to make investors feel obliged to chase returns, to take excessive risks to achieve even their mundane goals. If you can’t achieve those goals with safe investments – and economic policy has made that nigh on impossible – you move out on the risk scale until you can because the alternative – spending less, saving more – has been deemed un-American, economically unpatriotic. The unspoken agreement – unspoken by the Fed certainly but widely accepted and believed – is that the monetary powers that be will maintain risky assets at the high prices that have, according to the Fed, produced or at least enhanced whatever meager recovery we’ve had since 2009. A permanently high plateau , if you will. The problem is that this unspoken agreement, this economic wink and a nod, has produced moral hazard on an epic scale. People do stupid things when they think their rewards are deserved and any losses will be absorbed or prevented by others. If you doubt that, just take a few moments to remember the structure of the mortgage system that produced the last crisis. It was a system where government policy didn’t just implicitly relieve lenders of the risks of their loans, they did it explicitly by either guaranteeing the loans or buying them outright. Now we apply that lesson to all investors, the Fed equally concerned about the stock index and the price index. It has “worked” so far in that risky asset prices are high but the economic payoff is less clear. It may be that the US and global economy is better off today than it would have been without the exertions of the world’s central bankers, but you’d be hard pressed to prove it. Considering the moral lessons being taught by these policies one can’t help but wonder if the gains are worth the potential losses. Markets, individuals, will eventually see through the Fed’s illusion of control and mark assets to a real market. The list of winning investments – risky investments – has been pared down to just a few over the last two years and the list gets shorter every day. Most recently the junk bond market has been quietly deleted or at least partially erased from the winners list. With oil prices falling again, the fracking companies bankers are balking of course, but it isn’t just energy companies that are being denied financing. Several deals have been canceled recently that had nothing to do with fracking. And it isn’t just junk bonds that are getting marked down; the high grade corporate bond ETF (NYSEARCA: LQD ) has actually performed worse than its junk bond cousin over the last six months. You certainly can’t call it a credit crunch yet but the new normal economy may not need a full blown crunch to fall into recession. It is a frustrating time for investors and one that is fraught with danger. The risk isn’t from without, from some unknown black swan, but rather from within, from ourselves, the self-inflicted financial wound caused by greed and the very American desire to win, to do better than the next guy. It is tempting to discard the investment methods that have withstood the test of time in favor of the fad of the moment, the church of what’s working now. But in every investment cycle there comes a time when winning is accomplished by not losing, by ignoring the sirens of risk and lashing oneself to the mast of safety. Now would seem a good time to at least find the rope.

Why Capital Allocation Matters

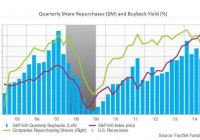
Summary Despite being a direct factor of long-term investor returns, few investors actually focus on identifying management teams that allocate capital well. Empirical studies suggest that even most management teams do not fully understand the importance of capital allocation on their business. The “holy grail” in investing is to find an excellent business, trading at a discount to fair value with a management team that allocates capital well. Introduction: Capital allocation is a topic of great importance to investors and management teams. At the core of any business is the simplistic NPV/IRR model which is used to answer a very simple question: Where should we invest? Whether a company invests in a new factory or an individual invests in a security, the concept is the same: If I outlay an amount today, how much will I expect to get in return in the future. Capital allocation in its simplest form is allocating capital from its various sources to its highest return. As author William Thorndike argued in his work, ” The Outsiders: Eight Unconventional CEOs and Their Radically Rational Blueprint for Success ,” the goal of a CEO is to properly allocate capital to its next highest return. The argument for such a quantitative measure of success is in stark contrast to the numerous more qualitative theories to excellent management. This article will focus on the goals of capital allocation and how an investor should logically assess the decisions management teams and Boards of Directors are making in regards to capital allocation decisions. As I previously mentioned in an older article, over long periods of time, compounding at higher rates creates exponential differences in ending values. Just like with investing, allocating capital in projects at high rates of return won’t matter as much in the short term but will matter tremendously in long term. Why Capital Allocation Matters: Capital allocation is the most critical aspect to generating long-term investment returns, yet despite many management teams making mention of the topic, their track record remains poor. A recent article posted in the HBR made a record of faults of current CEOs and their lack of focus on capital allocation. This is despite the fact that much of the financial theory regarding how value in a firm is created was first theorized in 1960s. So why do most CEOs perform poorly at what is arguably the most important for their position? A powerful argument, aptly discussed by legendary investor Warren Buffett in his 1987 Berkshire Hathaway (NYSE: BRK.A ) (NYSE: BRK.B ) Annual Letter, is that CEOs are more popularity contest than aptitude test. CEOs usually come up through the ranks of a company’s most important divisions such as sales, marketing, R&D or engineering. Their background and skill set is completely different as compared to what is actually required of them when they are promoted to CEO. This mismatch between a CEO’s background and the expectation for proper capital allocation by a firm’s investors has created the basis for typical activist investing. For all investors, the matter is still paramount when making investing decisions, especially those that are long term in nature. For the same exact business, excellent capital allocation will deliver excellent shareholder returns while poor capital allocation will do the opposite. How to Assess Capital Allocation Decisions: Management teams have a basic toolbox of decisions they can make to generate returns. The equation itself is relatively straightforward. First, capital can be obtained in four ways, the sale of debt, the sale of equity, the sale of assets and through internally generated operating cash flow. Next, the capital can be allocated in five different ways, either the issuance of dividends, the repurchase of stock, the retirement of debt, the purchase of other assets (M&A) or the reinvestment back into the business (i.e. Capex or net working capital additions.) Among each of these decisions, no specific one has precedence over the others. This is a critical concept that few investors or management teams truly appreciate. Whether capital is obtained through issuing debt or through operating cash flow, the capital is still finite and should be treated as such. A common misconception that many management teams and investors have is their view that operating cash flow is free and costless. This is not true as its real cost is the opportunity cost of other projects that could be done with the cash. Investors have been and should be upset when a management team uses operating cash flow to spend it on new internal projects with poor prospects of sufficient returns. Lastly, the question of capital allocation is not cut and dry. The best answer a management team could give investors regarding their view on capital allocation is: “it depends.” A common answer by some management teams might be to first spend on the business itself (new Capex or R&D) then pay a dividend and then use the rest of the excess capital for share repurchases. The graph below depicts this concept as share repurchases tend to peak during cyclical economic peaks, when operating cash flows are at their highest levels. (click to enlarge) This decision process is flawed, however, because capital should be allocated towards its next highest return. When a business is earning very high returns in its core business, reinvestment makes sense but if incremental returns are slowing, the company should not spend more despite the prospects of the business growing future revenues and profits. If the share price is substantially undervalued, the company should forego cash dividends and instead repurchase stock. If the share price is extremely expensive, M&A multiples far too high and all reinvestment opportunities exhausted, the last resort for management should be to pay a special cash dividend. This kind of flexibility in decision making may make investors nervous or less likely to buy a stock but it is the correct mindset for management teams who wish to drive attractive long-term shareholder returns. Finding Management Teams with Good Capital Allocation Skills: How does one find which management teams are apt at capital allocation? First, assess how a company’s management team discusses and presents its view on capital allocation. Does management think growth in the business should come at all costs? Are they beholden to a cash dividend no matter what other options for capital allocation exist? Do they not have an internal hurdle rate for returns when they do an M&A transaction? These types of viewpoints are indicative of a management team that does not have a solid grasp on proper capital allocation. Good management teams will describe the financial reasoning for their decisions. For example, for an M&A transaction, mentioning of the multiple to EBITDA or cash flow and how the deal is accretive to EPS and attractive on an ROIC basis are all needed to be sure the management team is doing due diligence. If a company is making share repurchases, they should make mention of their view on how undervalued the shares are. If the company is making share repurchases no matter what the multiple of the stock is to EPS or FCF, that is a telltale sign that management isn’t focused on capital allocation. Conclusion: Investors should be very wary of management teams and their capital allocation skills. Many CEOs move up through a company in divisions that don’t train them in proper capital allocation, leaving them less than apt at making investors above average shareholder returns. By staying focused on how management teams allocate capital, investors can figure out whether their investments’ management teams are making capital allocation decisions that maximize future shareholder returns. Disclosure: I/we have no positions in any stocks mentioned, and no plans to initiate any positions within the next 72 hours. (More…) I wrote this article myself, and it expresses my own opinions. I am not receiving compensation for it (other than from Seeking Alpha). I have no business relationship with any company whose stock is mentioned in this article.