Tag Archives: function

3 Keys To Navigating A Low Return Environment (Video)

2015 has me wondering – is this a precursor to what the future could look like? That is, are the low returns across so many asset classes likely to be a sign of what’s to come? In a BNN interview from this morning, I laid out the case for why returns are likely to be lower, and how we can be proactive about it. Here’s the gist of my thinking: We know that the Global Financial Asset Portfolio is roughly a 45/55 stock/bond portfolio today. We also know that bonds likely won’t generate high returns in the future, given the low interest rate environment (current rates are a very reliable indicator of future returns). We also know that stocks are overvalued by many metrics, and are very likely more risky than they were in 2009/10/11. So, let’s be generous on the stock side and assume 10% returns and 3% from bonds (also generous given the aggregate yield of about 2.5%. That gets us to about 6.5%. But what’s scary about the 6.5% is that it will be driven mainly by the inherently more risky piece of the portfolio – the stocks. So, returns are likely to be lower and/or riskier than we’re used to. Given this high-probability outcome, I think the markets have forced us to get creative to some degree. No one in their right mind is going to hold a 30-year T-bond to maturity, given the near-0% probability of generating a high real return. Likewise, given the risks in stocks, I think you have to be somewhat selective about where you diversify. So, what can we do? I offered three keys: Control what you can control. The only way to guarantee higher returns is by reducing taxes and fees. My general rule of thumb is to try to always maintain a 366-day time frame and never pay more than 0.5% per year in fees. Diversify, but don’t diworsify. You can be diversified without owning everything in the whole world. This market environment is forcing us to be somewhat selective about where we diversify our assets. I focus on a cyclical approach . Learn to be dynamic without being tax- and fee-inefficient. A static 50/50 or 60/40 isn’t likely to generate the types of returns investors have become accustomed to. You can be strategic in your portfolio without being hyperactive. This could mean a more thoughtful approach to rebalancing, or it could mean veering more into strategic asset allocation. “Active” is only a four-letter word in this business if it’s tax- and fee-inefficient. After all, as I’ve discussed repeatedly , we all have to be active to some degree, but there are smart ways to do this and self-destructive ways to do this… You can watch the full interview here: Share this article with a colleague

Economic Lethargy Continues To Bankroll The U.S. Stock Bull

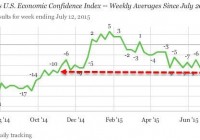
Both wage growth and employment have shown lackluster improvement since the end of the Great Recession in mid-2009. Americans do not believe the economy is improving because they are not earning more money or securing higher-paying employment. The weaker the economic picture, the more likely the stock bull will prevail. Over the past century, the U.S. stock market typically turned down prior to the onset of a recession. You did not need to predict economic contraction; rather, you monitored the Dow and the S&P 500 because the benchmarks acted like leading indicators of bad times ahead. (Investors checked the market internals to get a sense for whether or not stocks themselves might “roll over.”) Stocks demonstrated their predictive powers as recently as October of 2007. The bear market eroded 20%-30% of value before the National Bureau of Economic Research (NBER) even acknowledged the recession’s inception date (12/07) in October of 2008. On the flip side, U.S. equities in today’s world do an atrocious job at recognizing economic sluggishness. The skepticism of chief financial officers (CFOs) at the largest corporations just hit two-year lows. Small business optimism registered its worst reading in 15 months. Meanwhile, you’d have to travel back to November of 2014 to find the sort of pessimism that exists today on the part of the American public. “Gary,” you protest. “People do not always act based upon the way that they feel.” Just the facts, then? The industrial sector – an economic segment that incorporates manufacturing, mining, and utilities – posted its weakest year-over-year (YOY) growth in more than five years. Wholesale sales (YOY) have been in steady decline since 2011, contracting 3.4% in June. Retail sales plummeted in June as well. (No snow. Was it just too hot outside?) And perhaps most importantly, both wage growth and employment (as a function of the population) have shown lackluster improvement since the end of the Great Recession in mid-2009. The take-home is twofold. First, Americans do not believe the economy is improving because they are not earning more money or securing higher-paying employment. For instance, the erosion of roughly one-and-a-half million higher-paying manufacturing jobs has been supplanted by the same number of lower-paying waiter/bartender positions. This dynamic hardly represents economic well-being. Second, the weaker the economic picture, the more likely the stock bull will prevail. In fact, the entire reason that the Federal Reserve needed to enact three rounds of electronic money creation via quantitative easing ($3.75 trillion in “QE”) on top of six-and-a-half years of zero percent overnight lending rates is because the economy has been too weak to tighten borrowing costs. Ironically, Fed chairwoman Yellen maintains that she anticipates hiking rates some time in 2015. Even though annual economic growth throughout the recovery has been stuck near the 2% level? Even as the Fed has downgraded its own expectations for economic expansion for the seventh consecutive year? Even as the the Fed has overestimated the pace of expansion in each of the last seven years? The bond market via the iShares 7-10 Year Treasury Bond ETF (NYSEARCA: IEF ) is not entirely sure if overnight lending rates will be bumped up or not. The fact that the slope of the 50-day moving average has turned lower here in 2015 suggests higher yields in the future, in much the same way that the announcement of QE tapering sent bond yields skyrocketing in 2013. However, IEF’s higher lows over the past five weeks coupled with strong resistance for the 10-year yield near 2.5% may suggest otherwise. Even more intriguing is the likelihood that the pace of any rate hikes may be more important than the timing of the first shot. September? Doubtful. December. Probably. Yet fed funds futures have only priced in a rate of 0.75% by the end of 2016. Only three rate hikes over the next 18 months? Or maybe it will be six at 0.125% so that the pace is even slower than the seemingly preordained quarter-point moves. (You heard the concept of one-eighth of a point here first!) Impressively, stocks continue to benefit from every economic downgrade as well as the lowered expectations for the rate hike timeline. If the European Central Bank (ECB) in Europe can successfully kick Greek debt woes down the pathway – if Chinese authorities can successfully decree that “thou shalt buy-n-hold Shanghai shares” – U.S. stocks may not have much too fear. Indeed, the uptrends for core holdings like the iShares S&P 100 ETF (NYSEARCA: OEF ), the Health Care Select Sect SPDR ETF (NYSEARCA: XLV ) and the Vanguard Information Technology ETF (NYSEARCA: VGT ) remain intact. At the same time, we’re holding a larger-than-usual amount in cash/cash equivalents (15%) in most portfolios. Debt-fueled excess in Greece, Puerto Rico and China gave us a peek of the challenges that central banks around the world will be facing. Global economic deceleration and sky-high U.S. valuations are another. We anticipate an opportunity in the 2nd half of 2015 to buy quality assets at significantly lower prices. Disclosure: Gary Gordon, MS, CFP is the president of Pacific Park Financial, Inc., a Registered Investment Adviser with the SEC. Gary Gordon, Pacific Park Financial, Inc, and/or its clients may hold positions in the ETFs, mutual funds, and/or any investment asset mentioned above. The commentary does not constitute individualized investment advice. The opinions offered herein are not personalized recommendations to buy, sell or hold securities. At times, issuers of exchange-traded products compensate Pacific Park Financial, Inc. or its subsidiaries for advertising at the ETF Expert web site. ETF Expert content is created independently of any advertising relationships.

Closed-End Bond Funds Near Their Deepest Discounts Since 2008

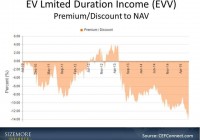
While most of the world’s attention has been on the China market meltdown and the Greek debt showdown, closed-end bond funds have quietly been priced to deliver solid total returns over the next 12-18 months. To take advantage of this pricing, I have carved out an 8%-10% allocation to closed-end bond funds in my Dividend Growth Portfolio . With the Fed’s looming rate hike casting a shadow over the bond market, many high-quality closed-end bond funds are trading at their deepest discounts to NAV since the 2013 “taper tantrum,” and some are approaching levels last seen during the 2008 meltdown. Starting at these levels, I expect a portfolio of closed-end bond funds to deliver total returns (income + capital gains) of 15%-20% over the next 12-18 months. With any closed-end mutual fund, you have only three potential drivers of returns: Current income: Closed-end bond funds generally pay monthly distributions earned from bond interest and stock dividends. Capital appreciation of portfolio: As with any mutual fund or ETF, the underlying portfolio value will rise or fall with market conditions. Change in discount/premium to NAV: Unlike mutual funds or ETFs, the market price of a closed-end fund will trade at a discount or premium to its underlying net asset value (“NAV”). In today’s market, I expect all three of these drivers to work to our benefit. I’ll start with current income. At current prices, many closed-end funds are delivering current yields well in excess of 7% without dipping too heavily into lower-quality junk. These outsized yields are made possible by the discounts to NAV and by the modest amount of leverage the funds use. Capital appreciation of the portfolio is going to depend on the bond market cooperating. Right now, investors are dumping bonds out of fear of the pending “liftoff” of the Fed funds rate. But with inflation still very low and with lower bond yields overseas acting as an anchor, I don’t expect bond yields to rise much from current levels. In fact, I think it’s very likely that bond yields drift modestly lower from here, which would be a boon to closed-end fund pricing. And finally, we get to the discount/premium to NAV. It’s normal for these funds to trade at modest discounts to their NAV. It’s when that discount gets wider (or smaller) than usual that you need to stand up and take note. And today, the discounts are near their widest points in years. (click to enlarge) To better explain what I’m talking about, let’s look at an example. I’ve been buying shares of the Eaton Vance Limited Duration Income Fund (NYSEMKT: EVV ) in recent weeks. EVV owns a portfolio of bonds and bank loans and yields a very respectable 8.9%. Its portfolio has lost value this year as bond yields have crept higher, yet its market price has fallen much faster than its NAV. As a result, EVV is now trading at its deepest discount to NAV in five years: 12.7%. As recently as two years ago, EVV was trading at a 4% premium to NAV. What kind of returns should we expect here? Let’s do a little back-of-the-envelope math. We have the current yield of 8.9%. Assuming no improvement in NAV but that the fund’s discount improves from the current 12.7% to a more reasonable 7%, you’d tack on another 5%-6%. That gets us to just shy of 15% total returns. And if the underlying NAV rallies – and I expect it will – we can get to total returns of 20% pretty quickly. Are those amazing returns to write home about? No. But are they a lot better than what I expect the broader market to deliver over the next 12-18 months? Absolutely. Disclosure: Long EVV. This article first appeared on Sizemore Insights as Closed-End Bond Funds Near Their Deepest Discounts Since 2008 Disclaimer: This article is for informational purposes only and should not be considered specific investment advice or as a solicitation to buy or sell any securities. Sizemore Capital personnel and clients will often have an interest in the securities mentioned. There is risk in any investment in traded securities, and all Sizemore Capital investment strategies have the possibility of loss. Past performance is no guarantee of future results.