Tag Archives: function

Everyone Should Consider These Crisis-Immune Stocks

Summary After six years of rising share prices in the United States, I start to feel a little uncomfortable with current valuations. In this article I try to find out which companies and industries are likely to do well when the going gets tough in financial markets.. I calculated the share returns of American S&P 500 companies and European Stoxx 600 companies and industries during the financial crisis in 2008. I intend to increase the weights of stocks in my portfolio that are active in defensive sectors like consumer staples, health care, utility and energy. Readers can look for their own crash-resistant company in a spreadsheet list that is provided at the end of the article. My dilemma is simple. Professor’s Jeremy Siegel’s plea that stocks are the best asset class to own in the long run is very convincing (please read his brilliant books Stocks in the long run and The Future for Investors ). However, at the current valuations I strongly believe long run future returns will be low single digit at best for the S&P 500 as a whole, see this previous article of me. The simple answer to this dilemma is that I should look for the right stocks. I argued in earlier articles that I like to invest in companies that have their earnings protected by a wide moat such Wal-Mart (NYSE: WMT ), Nestlé ( OTCPK:NSRGY ) and Unilever (NYS: UN ). In my view these companies will be able to generate handsome returns despite above average valuations, because they can invest every dollar they retain out of profits in a very lucrative way. In previous articles, I reasoned that investors should ignore short term price fluctuations if they are convinced the earnings power – that is the possibility to reinvest retained earnings in a lucrative way – has not changed. As long as the sustainable competitive advantage of the company – or what super investor Warren Buffett calls a moat – is unaltered, there is absolutely no reason to sell your shares. This point of view makes perfect sense in theory. In practice when shares plummet day after day and everybody thinks the end of civilization is near, it is extremely difficult to assess the long term earnings power of a company. Therefore, the purpose of this article is to find companies that are great investments and tend to do well when things get tough in financial markets. Forget useless math If have read dozens of (academic) papers and books on the concept of risk. The trouble is that most of the metrics used in finance – think volatility, beta, Value at Risk, etc – are close to useless in the real world because they explicitly or implicitly assume share returns are distributed according to a so called normal distribution (almost all the returns are close to the average). In the real world investors are faced with outliers, or returns that are light years away from the average. Although the academic world tries to construct models that try to deal with outliers, the approach I use to capture risk of individual shares in this article is extremely simple (the way I prefer things to be). I calculated the returns of stocks in particular sectors and individual stocks in the United States and Europe from top to bottom during the credit crisis. To be honest, the saying ‘financial markets have no memory’ seems applicable to me. I was a little shocked by the returns that were spitted out by my Bloomberg terminal doing the analysis. In the credit crisis the S&P 500 and Stoxx 600 – the 600 biggest European companies by market capitalization – lost 55.2 percent and 58.2 percent respectively of their value from top to bottom during this period. Stomach this! Stocks lost more than half of their value during the credit crisis Index Top Bottom Total Return S&P 500 index 10-9-2007 9-3-2009 -55.2% Stoxx 600 1-6-2007 9-3-2009 -58.2% Source: Bloomberg. Nowhere to hide I suspect that most readers are familiar with the story about the statistician who drowned in a lake with an average depth of six inches. Averages can be dangerous as the distribution around the average can be wide. Therefore, I grouped the companies in industry segments to see how each segment reacted during the crisis. I use the Global Industry Classification Standard (GICs, you can find which industry group belongs to which sector on this wiki page). Which American industry did best and worst during the credit crisis? Returns of S&P 500 Companies Returns of Stoxx 600 companies Sector # Mean Rec. return Sector # Mean Rec. return Consumer staples 33 -33,1% 49,4% Energy 23 -32,7% 48,5% Health care 50 -39,1% 64,3% Health care 36 -33,9% 51,4% Utility 29 -40,9% 69,3% Telecom services 19 -35,2% 54,3% Energy 37 -49,2% 96,8% Consumer staples 44 -36,8% 58,3% Materials 26 -50,5% 101,9% Utility 25 -38,8% 63,3% Information technology 62 -51,2% 105,1% Materials 48 -50,3% 101,1% Consumer discretionary 77 -53,6% 115,4% Information technology 27 -52,3% 109,7% S&P 500 -55,2% 123,3% Industrials 111 -54,7% 120,6% Industrials 60 -55,8% 126,0% Stoxx 600 -58,2% 139,0% Telecom services 6 -56,3% 129,0% Consumer discretionary 81 -60,1% 150,7% Financials 86 -68,1% 213,4% Financials 121 -64,6% 182,1% Source: Bloomberg. Return represents total shareholder return, including dividends. # represents the number of companies within each sector. Recovery return is the return necessary to recover your initial investment. Given the nature of the last big crisis I suspect few readers will be surprised by the worst performing sector: financials. Financial companies lost a staggering 68.1 percent in the U.S. and 64.6 percent in Europe of their market value from top to bottom. Note that in some cases the investors had to deal with the worst thing that could happen to a value investor: a permanent loss of capital. For example Lehman Brothers went bankrupt and both Bear Stearns (JP Morgan) and Wachovia (Wells Fargo) were absorbed by other investment banks. It is good news for investors that the top performing sectors are also fairly similar on both sides of the ocean. The sector consumer staples (mainly food, beverages, tobacco and personal products), Health care (equipment, pharmaceuticals and biotech), Utility and Energy are all represented in the top five in both the U.S. and Europe. The average returns of these sectors are all above the average of the market. Do not get me wrong: the performance was still horrible. This was the scary thing of the credit crisis: every share and asset class – even gold! – collapsed due to the a complete loss of faith in the financial system. But – and this is in my opinion very important – even in the credit crisis it still mattered a lot if the value of your portfolio dropped by 33 percent (fully invested in consumer staples), 55 percent (invested in the index) or 68 percent (fully invested in financials). Let’s do the math. If the value of a portfolio drops by 33 percent an investors needs a return of about 50 percent to get back to where he or she started. But if you lost 55 percent or 68 percent of value an investor needs a return of respectively 123 percent (factor 2.5) and 213 percent (factor 4.3!) to recover you initial investment value. You find the ‘recovery returns’ of each individual sector in the table above. As a side note I like to inform you that I also examined the returns of each industry in the aftermath of the burst of the internet bubble in 2000 in both the U.S. and Europe. In that period the same defensive sectors outperformed the market (most of these sectors even realized positive returns as the loss in market capitalizations was concentrated in internet companies). A quest for cheap crash proof stocks After a 6 year period in which markets have treated us well – again leading to expensive stocks – it makes sense to me to increase the weights in my portfolio to stocks that tend to do well in downturns. Therefore, I am looking for stocks that are active in the consumer staples, health care, utility and energy sector. However, although I favor the simple over the complex, there is always the risk of taking too many shortcuts. An investor always runs the risk that stocks that were resilient in 2007 will prove to be horrible investments during the next crash. The thing I do to deal with this problem is to look at valuations. As a value investor, I believe the price you pay determines the return of a financial asset. This implies an investor can pay too much, even for the most defensive stock. My method to find crash proof shares is fairly straightforward. In this spreadsheet you find the names of the shares of the S&P and Stoxx companies, its sector and return during the credit crisis (source: Bloomberg). Moreover, I added the P/E-ratio in 2007 (pre-crisis) and the current P/E of every share. In my quest for resilient stocks I look for shares in defensive sectors that have P/E-ratios that are similar, preferably lower, than before the crisis. In the last step an investor should investigate if there is a reason for the low valuation. The investors should for instance examine if the nature of the business have changed permanently in the past 6 years due to divestitures or acquisitions. Investors should also try to assess whether the markets for its end products have structurally changed due to disruptive entry of new competitors (although I believe one can find value in oil today, some investors believe this could be the case with oil stocks). I additionally cannot stress enough the importance of a strong balance sheet. In the aftermath of the credit crisis, I have seen billions of shareholder value getting destroyed by overleveraged companies that faced a decline in cash flows and had to raise capital at very unattractive terms for existing shareholders to survive. Wal-Mart as an example It is beyond the scope of this article to examine individual stocks in great detail. For now I only want to have a close look at the best performing sector in the U.S. during the credit crisis: consumer staples. The best performing stock in this sector is retail giant Wal-mart. To me it is absolutely amazing this stock gained 7 percent in the worst investment climate ever. In this long read article, I extensively argue that Wal-Mart is an attractive investment at the current valuation. After my analysis of today, I decided to increase my position in the company. I not only expect attractive long run returns of Wal-mart, I also expect the stock will be resilient in an unfortunate scenario where markets start turning against us. Thanks for reading, and I hope you find some great stocks yourself by scrolling down the list — please let me know which. Editor’s Note: This article discusses one or more securities that do not trade on a major U.S. exchange. Please be aware of the risks associated with these stocks. Disclosure: I am/we are long WMT. (More…) I wrote this article myself, and it expresses my own opinions. I am not receiving compensation for it (other than from Seeking Alpha). I have no business relationship with any company whose stock is mentioned in this article.
Improving Basic Structural Arbitrage

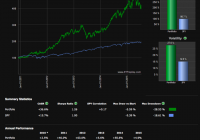
Adding long dollar index exposure is highly logical. It reduces the strategy index’s correlation to bonds. And it provides multiple forms of statistical hedging. As long time readers know, the idea behind Structural Arbitrage is that profits are possible by acting as a synthetic insurance company which sells expensive insurance in the volatility market, and then synthetically reinsures that market risk with long duration government bonds. To review, here are the basic strategy index’s rules: I. Buy XIV (NASDAQ: XIV ) with 40% of the dollar value of the portfolio. II. Buy TMF (NYSEARCA: TMF ) with 60% of the dollar value of the portfolio. III. Rebalance weekly to maintain the 40%/ 60% dollar value split between the positions. XIV is the inverse short term volatility ETN. TMF is the 3X leveraged 20+ year government bond ETF. Here are the strategy’s results in a linear scale: (click to enlarge) For those of you who don’t believe that such a simple strategy index could work, I made the strategy public in an ebook back in 2013. If a relationship is robust, it can still make money even if it is widely studied. The potential problem, though, is the correlation of the strategy to bonds, as we can see in the graph below which compares the strategy to its TMF component: (click to enlarge) Even though the R squared value of a 0.61 correlation to TMF isn’t horrible, it’s not great either. And as I’ve said again and again , I believe that the strategy in its original form should be abandoned, due to the risk of a prolonged bear market in bonds. A simple improvement would be to add long dollar index exposure through an instrument such as UUP. The logic is “if then” logic. If interest rates rise, TMF will fall, but the dollar might strengthen, since the higher yield makes dollars more attractive than alternatives. What exactly would an improvement consist of? Here are the improved strategy’s rules: I. Buy XIV (NASDAQ:) with 15% of the dollar value of the portfolio. II. Buy TMF (NYSEARCA:) with 15% of the dollar value of the portfolio. III. Buy UUP (NYSEARCA: UUP ) with 70% of the dollar value of the portfolio. IV. Rebalance annually to maintain the 15%/ 15%/70% dollar value split between the positions. Here are the strategy’s results in a linear scale: (click to enlarge) The strategy now lags the S&P by 1.1% per year, but the drawdown is reduced by almost 8 percentage points, far improving the CAGR/Max drawdown ratio, called the MAR, compared to that of S&P 500. Let’s take a look at the correlation of the strategy to its long bond TMF component: (click to enlarge) The improved strategy index’s correlation to TMF dropped from 0.61 to 0.35. And the improved strategy index’s correlation to the S&P 500 is only 0.13 (pretty amazing) dropping from an already impressive 0.17 level. For the investor who is looking for a return stream which is largely uncorrelated to stocks and uncorrelated to bonds , this improved strategy index is pretty neat. Both long bonds and long dollar index exposure can often statistically hedge short volatility exposure. The lesson here is that multiple forms of hedging are usually better if the goal is robustness and non-correlation. Thanks for reading. Disclosure: I/we have no positions in any stocks mentioned, but may initiate a long position in XIV, TMF, UUP over the next 72 hours. (More…) I wrote this article myself, and it expresses my own opinions. I am not receiving compensation for it (other than from Seeking Alpha). I have no business relationship with any company whose stock is mentioned in this article.

Look To Taiwan For Stability And Low Valuation

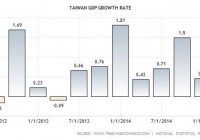
Summary The iShares MSCI Taiwan ETF has extremely low valuation at the moment. Taiwan experienced a large drop in exports in June, while exports are expected to begin increasing in the 3rd quarter of 2015; this has created a buy opportunity. Taiwan is a very stable country to invest in; there has been conservative economic growth, low inflation, consistent trade surpluses, and negligible exchange rate movements. In previous articles, I have mentioned investment opportunities into fast growing economies such as the Phillipines and Indonesia through ETFs, and believe these regions have ample potential. However, Taiwan presents itself as a more stable investment option, and valuation is extremely attractive at the moment. I have decided to turn my attention to the iShares MSCI Taiwan ETF (NYSEARCA: EWT ), as a means for investors to gain exposure to Taiwan. GDP Growth GDP growth in Taiwan can be characterized as very consistent and moderate. Future projections provide the same results more or less, with a slightly more beneficial outlook; GDP growth is expected to rise 2.7% year on year until 2019 . Other forecasts, after assessing China’s threat to Taiwan’s exports, have lowered GDP growth projections from 3.78% to 3.28% in 2015 . The benefit with Taiwan thus can be characterized as stability, coupled with moderate and consistent growth projected for the future. (click to enlarge) Source: Trading Economics. FX Risks One benefit of investing in Taiwan is its extremely stable currency and low inflation rate. The exchange rate movement for this currency has been negligent, with an average rate of 31.25 since 1979, and has most recently been consistently close to 30 in recent years. Inflation has also been very low, and has mostly recently been -0.56% in June 2015. Towards the end of 2015, inflation averaged between 0.6% to 2%. Taiwan has the comparative advantage of low inflation and negligent exchange rate movement, when compared to other countries in Asia. The rise of Taiwan’s currency, which is rising faster than Japan, South Korea, and China, does present a threat to its tech exports , as this contributes vastly to its economy. Consistent Trade Surplus As a strong tech export country, it is favorable to note that Taiwan’s balance of trade has been on the rise in recent years. Projection for future balance of trade in Taiwan provides mixed results: Demand from developed markets continues to improve, mainly in the USA and Europe. This is balanced with caution, as the demand from emerging countries such as China has been decreasing. June has been a particularly challenging month for Taiwan, as export demands decreased by 13.9% , the largest decrease since February of 2015. (click to enlarge) Source: Trading Economics. Exports in Taiwan are projected to grow at a moderate rate for the next year. TWD Million Last Q3 2015 Q4 2015 Q1 2016 Q2 2016 Exports 709,860 752,876 755,280 754,089 751,775 Investors wishing to profit off of growth in exports, may find it beneficial to develop a short strategy, by waiting until the 4th quarter of 2015 when exports increase by 6.4%. While exports do not have substantial potential for growth based on these projections, having moderate growth in an export heavy country, with a stable currency and low inflation, makes this investment very conservative. Moreover, the valuation is incredibly low, and investors may determine it beneficial to hold this stock longer, and to choose a higher exit P/E. Economic Cooperation Framework Agreement The Economic Cooperation Framework Agreement , a significant trade deal completed with China in 2010, has already proved to be a catalyst for economic growth; the agreement has not been able to expand beyond its initial stages, due to protests beginning in March last year. The agreement was created to reduce tariffs and commercial barriers between the two countries. Currently, statistics have shown that the trade agreement has saved Taiwan $2.4 billion on tariffs and could boost the country’s GDP by 1.5% if fully implemented. With decreased demand from China and high dependency on exports for revenue, the full implementation of this agreement clearly has the ability to give Taiwan’s economy the boost necessary to achieve further growth. Taiwan Stock Market One last benefit of investment in Taiwan has been the consistent rise of the stock market since late 2014, coupled with the recent index plunge beginning in May of 2015. The Taiwan Stock Market is expected to increase to 9,390.06 points in 2016 , which represents a 5.3% increase. A moderate increase in the TSWE will be attractive, especially after examining the fast financial performance of the fund’s holdings later in this article. (click to enlarge) Source: Trading Economics. Diverse Growth Taiwan has had substantial growth in a wide variety of industries and areas in 2015: Taiwan’s industrial production index gained 6.49% year on year in March of 2015. During this time, construction also grew by 15.06%, and manufacturing of electronic components rose by 11.41%. Machinery and Equipment grew by 14.4% and chemical materials rose by 13.6%. Food services and retail both gained 1.9% and 1.3% respectively. Consumer spending has been significantly increasing since 2012, with a most recent annual increase of 2% in the 1st quarter of 2015. Taiwan’s manufacturing sector also reached an all time high in 2014, with a 3.5% year on year increase in revenue . Increased consumption and exports from Taiwan’s tech sectors have all contributed to the country’s economic growth. Moreover, increased wages has also been a catalyst for increased consumer spending, further contributing to economic growth. Taiwan has a strong advantage as a high tech export company, that domestically also has a very favorable outlook. While it is certainly not at its most strategic growth point, there is still growth ahead, and investors can feel confident regarding the country’s past economic performance. Moreover, the growth in manufacturing in Taiwan is crucial, as this will be another factor that will boost the economy and increase consumer’s confidence. Buy Opportunity EWT data by YCharts Things started to look less favorable in Taiwan beginning in June, when industrial production dropped -3.18%, as oppose to the 1.21% gain anticipated. As previously mentioned exports also decreased substantially during this month, at a two year record low. Poor performance in June attributed to the drop in the fund price; this creates a short term opportunity for the anticipated increase in exports and also an opportunity for long term investors to take advantage of the low valuation this has created. Price/Earnings 12.93 Price/Book 1.74 Price/Sales 0.94 Source: Yahoo Finance . Conclusion While Taiwan certainly has major threats ahead and will be no means among the fastest growing economies, the country can be characterized as a conservative country to invest in, that has acceptable levels of growth ahead. The current valuation of this fund is a key reason to invest in Taiwan at the moment, while investing in equity in Taiwan with higher valuation is not a very strategic investment objective; the economic environment in Taiwan is favorable, but there is not enough growth ahead to justify investing in companies with moderate or high valuation. Therefore, the investment approach to Taiwan should be considered accordingly, as it may not be the best environment for long term investment. Unless there is a considerable boost in Taiwan’s position as a tech export country, with increased exports to emerging countries specifically, it is best to sell this fund once the valuation is high or even average. Disclosure: I/we have no positions in any stocks mentioned, and no plans to initiate any positions within the next 72 hours. (More…) I wrote this article myself, and it expresses my own opinions. I am not receiving compensation for it (other than from Seeking Alpha). I have no business relationship with any company whose stock is mentioned in this article.