Tag Archives: function

Dividend Growth Stock Overview: SJW Corporation

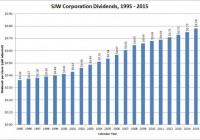
About SJW Corporation SJW Corporation (NYSE: SJW ) provides water services to customers in the San Jose, CA metropolitan area and to customers in the region between San Antonio and Austin, TX. The company was incorporated in California in February 1985, and is headquartered in San Jose. SJW has 395 full-time employees. The company is organized into four subsidiaries: (1) the San Jose Water Company; (2) SJWTX, Inc.; (3) SJW Land Company; and (4) the Texas Water Alliance. SJW Corporation does not report financial information for each of the subsidiaries separately. Originally incorporated in 1866, San Jose Water Company is the predecessor organization to SJW Corporation. In the 1985 reorganization, San Jose Water Company became a wholly-owned subsidiary of SJW Corporation. San Jose Water is a public utility that provides water service to over 1 million people in the metropolitan San Jose area. The company’s supply comes from a variety of sources, including groundwater, surface water, reclaimed water and imported water. Roughly 40-50% of its annual water production is purchased. SJWTX was incorporated in Texas in 1985, and does business as Canyon Lake Water Service Company. This subsidiary provides water service to roughly 36,000 people located in the region between San Antonio and Austin, TX. SJW Land Company owns undeveloped land in California and Tennessee, owns and operates commercial buildings in California, Arizona and Tennessee, and has a 70% interest in a real estate limited partnership. Finally, the Texas Water Alliance subsidiary is developing a water supply project in Texas to ensure future water supplies for the Canyon Lake Water Service Company. As a regulated utility, local and state authorities dictate SJW’s revenues and income. In 2014, the company had operating revenue of $320 million, which was up 15.5% from 2013. Net income more than doubled from 2013 to $51.8 million. Earnings per share did the same, coming in at $2.54, which gives the company a payout ratio of about 31% using the current annualized dividend of 78 cents per share. The revenue and income increase was due to approved rate changes, slightly offset by a reduction in customer water usage. The revenue increase continued in the 1st quarter of the year, with a 13.7% increase in revenue and a more than quadrupling of net income for the quarter year-over-year. In addition to the rate increases, the significant increase in net income was also due to a reduction of groundwater extraction costs. As a company that predominantly operates public utilities, SJW has had, and expects to have, large capital improvement expenditures. The company spent nearly $92 million on capital expenditures in 2014. In 2015, it plans to spend over $133 million as part of more than $660 million in capital improvements from 2015 to 2019. The company is a member of the Russell 2000 index and trades under the ticker symbol SJW. As of mid-July, the stock yielded 2.5%. SJW Corporation’s Dividend and Stock Split History (click to enlarge) SJW has grown dividends at less than 4% a year since 1995. SJW Corporation and its predecessor companies have paid dividends since 1944, and increased them since 1968. It announces annual dividend increases at the end of January, with the stock going ex-dividend in the first half of February. In January 2015, SJW announced a 4% dividend increase to an annualized rate of 78 cents per share. The company should announce its 49th consecutive annual dividend increase in January 2016. SJW Corp. historically increases its dividend in the low- to mid-single digit percentages, and the dividend growth rates reflect this. The company’s 5-year compounded annual dividend growth rate (CADGR) is 2.78%. Longer term, the CADGRs are slightly higher: the 10-year CADGR is 3.81%, the 20-year CADGR is 3.94% and the 25-year CADGR is 3.76%. SJW has split its stock twice. The splits occurred in close succession, with the company splitting the stock 3-for-1 in March 2004 and then 2-for-1 in March 2006. A single share purchased prior to March 2004 would have split into 6 shares. Over the 5 years ending December 31, 2014, SJW Corporation stock appreciated at an annualized rate of 10.40%, from a split-adjusted $19.35 to $31.73. This underperformed the 13.0% compounded return of the S&P 500 index and the 14.0% compounded return of the Russell 2000 Small Cap index over the same period. SJW Corporation’s Direct Purchase and Dividend Reinvestment Plans SJW does not have a direct purchase or dividend reinvestment plan. (The company initiated one for investors in 2011, but terminated it in 2014.) In order to invest in the stock, you’ll need to purchase it through a broker; most will allow you to reinvest dividends without any fee. Ask your broker for more information on how to set this up, if you are interested. Helpful Links SJW Corporation’s Investor Relations Website Current quote and financial summary for SJW Corporation (finviz.com) Disclosure: I do not currently have, nor do I plan to take positions in SJW.
RPV Is A Strong ETF For Exposure To The Value Portion Of SPY

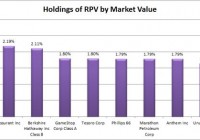
Summary The performance of the ETF has been fairly solid. The standard deviation gives it some risk, but not too much. The holdings of the ETF are at least adequately diversified and I like the positions. The decent liquidity doesn’t hurt when investors want to rebalance their portfolios. The Guggenheim S&P 500® Pure Value ETF (NYSEARCA: RPV ) has surprised me. With a higher turnover ratio and expense ratio, the fund has thoroughly outperformed SPY since inception. During the time frame I used for my regression, RPV was up 119% relative to the SPDR S&P 500 Trust ETF (NYSEARCA: SPY ) being up 96%. Impressive work and great for the people that decided to buy into it when the ETF started. What does RPV do? RPV attempts to track the investment results of S&P 500 Pure Value Index. The ETF falls under the category of “Large Value” presently, but was classified under “Mid-Cap Value” previously. The category may be prone to change as the ETF has a 25% portfolio turnover. Does RPV provide diversification benefits to a portfolio? Each investor may hold a different portfolio, but I use SPY as the basis for my analysis. I believe SPY, or another large cap U.S. fund with similar properties, represents the reasonable first step for many investors designing an ETF portfolio. Therefore, I start my diversification analysis by seeing how it works with SPY. The correlation is about 88.86%, which is low enough to allow more diversification benefits than I would expect in a fund referencing the S&P 500. Standard deviation of monthly returns (dividend adjusted, measured since March, 2006) The standard deviation is terrible. If investors want to ensure that they are keeping volatility out of their portfolio, this won’t be the ETF. That’s a little ironic to me because over long sample periods I wouldn’t expect a value ETF to show so much more volatility than SPY. For the period I’ve chosen, the standard deviation of monthly returns was 7.021%. For SPY, it was 4.416% over the same period. Mixing it with SPY I also run comparison on the standard deviation of monthly returns for the portfolio assuming that the portfolio is combined with the S&P 500. For research, I assume monthly rebalancing because it dramatically simplifies the math. With a 50/50 weighting in a portfolio holding only SPY and RPV, the standard deviation of monthly returns across the entire portfolio is 5.566%. If the position in SPY is raised to 80% while RPV is used at 20% the standard deviation of monthly returns drops down to 4.824%. In practice, I think the best way to use RPV is a position smaller than 20% and used in a diversified portfolio. The moderate correlation makes a strong case for using RPV in a small position so the volatility has less impact on the overall portfolio. At 5%, the standard deviation of the portfolio would have been 4.510%. Compared to SPY at 4.416%, this is a fairly low increase in the risk level measured by the standard deviation. Why I use standard deviation of monthly returns I don’t believe historical returns have predictive power for future returns, but I do believe historical values for standard deviations of returns relative to other ETFs have some predictive power on future risks and correlations. Yield & Taxes The distribution yield is 1.98%. It’s a little on the low side for the value focus, but not too low if it is only being considered for a portion of the portfolio. Due to the higher volatility of returns on this “value” ETF, I really appreciate seeing a higher distribution yield. The major risk, in my opinion, is that investors tend to withdraw their money at the worst possible times. Expense Ratio The expense ratios are both running .35%. It isn’t too bad and seems to be the standard for Guggenheim ETFs. I’d prefer lower, but this is still within reason. Market to NAV The ETF is trading at a .06% discount to NAV currently. I think any ETF is significantly less attractive when it trades above NAV and more attractive below NAV. A .06% discount is not enough to matter though. Investors should check prior to placing an order, but the liquidity in RPV should be a great hedge against any meaningful premiums or discounts. Lately there have been more than 120,000 shares trading hands each day. With each share over $50, the resulting liquidity is enough that I would have no concerns. Largest Holdings The diversification is pretty good. I see nothing to complain about here. (click to enlarge) Conclusion RPV delivers a strong showing in my initial assessment. The liquidity is excellent and the correlation is about what I would expect for the ETF having a focus on the S&P 500 index. The performance was fairly solid over the test period in every regard. The biggest weakness would have to be the volatility of returns, but that sure won’t stop the ETF from reaching the next stage. The Guggenheim S&P 500 Pure Growth ETF (NYSEARCA: RPG ) tracks the other side of the index, having a focus on growth stocks. The interesting thing is over the last five years both RPV and RPG significantly outperformed SPY. If we limit the comparison to the last 5 years, SPY was up 111.5%, RPG was up 148.2% and RPV was up 134%. When I looked up the ETF they were holding 119 of the constituents of the S&P 500. Frequently the contenders for the value exposure in my portfolio will have fairly strong dividend yields. The yield on RPV isn’t that strong, but that seems like a fairly minor issue for me since I don’t anticipate any withdrawals from the portfolio for a long time. Within the 119 companies, the diversification isn’t bad. Only one holding was over 2.02% and I can’t complain about the selections. All around, I feel like this is a fairly solid group of companies the ETF is holding. The expense ratio is not too bad, cheaper than most though a certainly higher than my goals. I’m certainly willing to deal with that if the ETF fits nicely into my overall portfolio. Disclosure: I/we have no positions in any stocks mentioned, and no plans to initiate any positions within the next 72 hours. (More…) I wrote this article myself, and it expresses my own opinions. I am not receiving compensation for it (other than from Seeking Alpha). I have no business relationship with any company whose stock is mentioned in this article. Additional disclosure: Information in this article represents the opinion of the analyst. All statements are represented as opinions, rather than facts, and should not be construed as advice to buy or sell a security. Ratings of “outperform” and “underperform” reflect the analyst’s estimation of a divergence between the market value for a security and the price that would be appropriate given the potential for risks and returns relative to other securities. The analyst does not know your particular objectives for returns or constraints upon investing. All investors are encouraged to do their own research before making any investment decision. Information is regularly obtained from Yahoo Finance, Google Finance, and SEC Database. If Yahoo, Google, or the SEC database contained faulty or old information it could be incorporated into my analysis.

The Low Volatility Anomaly: Leverage Aversion Hypothesis

This series digs deeper into the Low Volatility Anomaly, or why lower risk stocks have historically produced stronger risk-adjusted returns than higher risk stocks or the broader market. The CAPM links expected returns with an asset’s sensitivity to systematic risk, but the model assumptions are impractical. This article covers a deviation between model and market that may contribute to the outperformance of low volatility strategies. Given the long-run structural alpha generated by low volatility strategies, I am dedicating a more detailed discussion of the efficacy of this style of investing. In the first article in this series , I provided an introduction to the strategy with a simple example demonstrating a low volatility factor tilt (replicated through SPLV ) from the S&P 500 (NYSEARCA: SPY ) that has generated long-run alpha. In the second article in this series , I provided a theoretical underpinning for the presence and persistence of a Low Volatility Anomaly, and linked to articles depicting its success dating back to the 1930s. This article demonstrates that violations of the assumption of the Capital Asset Pricing Model (CAPM) lead to deviations between model and market that pervert the presumed relationship between risk and return. Empirical evidence, academic research and long time series studies across asset classes and geographies have shown that the actual relationship between risk and return is flatter than the model or market expectations suggests. The third article in this theory lays out a hypothesis for why low volatility strategies have produced higher risk-adjusted returns over time. Leverage Aversion Hypothesis The fallacy of the Capital Asset Pricing Model assumption that investors are able to borrow and lend at the risk-free rate might be the supposition that most perverts the model application from real world practice. Certainly not all investors are able to use leverage, and the cost and availability of leverage can deviate materially from any notion of a risk-free rate in times of stress. Intuitively, leverage-constrained or leverage-averse investors often choose to overweight riskier assets, increasing the price of risky assets and lowering expected return. If some market participants are overweight riskier assets characterized by lower expected returns, then they must be underweight lower risk assets which would be characterized by higher expected returns. In the CAPM model, rational market participants seeking to maximize their economic utility invest in the portfolio with the highest expected return per unit of risk, and lever or de-lever their portfolio to suit their own risk tolerance. In practice, however, many large institutional investors including most mutual funds and certain pension funds are constrained by the level of leverage that they can take. Furthermore, many individual investors lack the sophistication or access to attractively priced leverage. The growing increase in the assets under management of exchange traded fund products with embedded leverage could well signal small investor’s inability to access leverage directly on favorable terms. If market participants respond by being overweight riskier securities, then the relationship between risk and expected return is altered. Building on the long time series studies from Black and Haugen of the relative outperformance of lower volatility assets in the last article in this series, Frazzini and Pederson (2010) empirically demonstrated the alpha-generative nature of low beta assets across twenty international equity markets, Treasury bonds, corporate bonds, and futures. The duo also introduced a “Betting Against Beta” factor that gave the paper its name. The factor is effectively a zero beta portfolio that is long leveraged low-beta assets and short high-beta assets to produce statistically significant risk-adjusted across many markets, geographies, and time intervals. This study also demonstrated that the return of the BAB factor is sensitive to funding constraints as one would expected in a trade involving leverage. The persistence of an alpha-generative strategy involving leverage applied to low volatility assets, whose excess return is in part a function of the funding environment, supports the Leverage Aversion Hypothesis as an explanation for the Low Volatility Anomaly. In the next section of this series, we will tackle how the delegated agency model typical of investment management may also contribute to the outperformance of Low Volatility strategies. Disclaimer My articles may contain statements and projections that are forward-looking in nature, and therefore, inherently subject to numerous risks, uncertainties and assumptions. While my articles focus on generating long-term risk-adjusted returns, investment decisions necessarily involve the risk of loss of principal. Individual investor circumstances vary significantly, and information gleaned from my articles should be applied to your own unique investment situation, objectives, risk tolerance, and investment horizon. Disclosure: I am/we are long SPLV, SPY. (More…) I wrote this article myself, and it expresses my own opinions. I am not receiving compensation for it (other than from Seeking Alpha). I have no business relationship with any company whose stock is mentioned in this article.