Tag Archives: fsbix

Fidelity Select Funds Portfolio Optimized For Low Volatility Performed Well In 2015

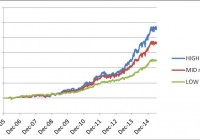
Summary LOW volatility portfolio: FIBIX, FSBIX, FSPHX, FSELX, FSCHX, FBMPX. MID volatility portfolio: FLBIX, FSBIX, FSPHX, FSELX, FSCHX, FBMPX. HIGH volatility portfolio: FLBIX, FIBIX, FSPHX, FSELX, FSCHX, FBMPX. The LOW volatility portfolio had a positive return so far in 2015 despite the interest rate uncertainty. In a previous article we presented the performance of a portfolio made up of five Fidelity select mutual funds. That portfolio had a stellar performance over the whole 27 year period starting in 1987. Back in July we decided to replace the GNMA fund (MUTF: FGMNX ) with two high quality government bonds. The performance of the two portfolios was discussed in the July article, the conclusion being that the new portfolio performed slightly better than the old one. In the first article I used a Relative Strength (RS) strategy based on a three-month look back evaluation period. In the second article I used a Mean-Variance Optimization (MVO) algorithm with 65-day look back evaluation period. While the MVO algorithm may approximate the RS algorithm if one selects the proper volatility target, the MVO strategy is very flexible, and it allows the investor to adapt it to the variable market environment. It turns out that during the first nine months of 2015 the RS strategy, as well as the Dual Momentum (DM) one, has performed poorly with a return of -15.22% for a 3-month look back, or -10.15% for a 12-month look back. The interested reader may verify the performance of Dual Momentum and Relative Strength on the portfoliovisualizer.com site. In this article we shall use only the MVO strategy and we want to emphasize the performance of the new portfolio during the first three quarters of 2015. We shall present three versions of this new portfolio for three levels of volatility: low, mid and high. The three versions are meant for investors with different risk tolerance. They also are meant for investors who may want to vary their risk level based on their evaluation of the markets. The portfolios are made up of the following funds: Fidelity Select Multimedia Portfolio (MUTF: FBMPX ) Fidelity Select Chemicals Portfolio (MUTF: FSCHX ) Fidelity Select Electronics Portfolio (MUTF: FSELX ) Fidelity Select Health Care Portfolio (MUTF: FSPHX ) Fidelity Spartan Long Term Treasuries Fund (MUTF: FLBIX ) Fidelity Spartan Intermediate Term Treasuries Fund (MUTF: FIBIX ) Fidelity Spartan Short Term Treasuries Fund (MUTF: FSBIX ) With the seven funds above, we created three portfolios to be used at three volatility levels: low, mid and high. All portfolios include the same four equity funds, but each one includes only two of the three treasury funds. The high risk uses FLBIX and FIBIX, the mid risk includes FLBIX and FSBIX, while the low risk has FIBIX and FSBIX. The data for the study were downloaded from Yahoo Finance on the Historical Prices menu for FBMPX, FSCHX, FSELX, FSPHX, FLBIX, FIBIX and FSBIX. We use the daily price data adjusted for dividend payments. The portfolio is managed as dictated by a variance-return optimization algorithm developed on the Modern Portfolio Theory ( Markowitz ). The allocation is rebalanced monthly at market closing of the first trading day of the month. In table 1 we present the performance of the portfolio for three levels of risk. Table 1. Portfolio performance from January 2007 to October 2015 TotRet% CAGR% VOL% maxDD% Sharpe Sortino 2015 return LOW risk 109.22 8.80 5.49 -7.50 1.60 2.10 1.75 MID risk 287.58 16.75 13.37 -16.97 1.25 1.69 -0.49 HIGH risk 569.16 24.26 20.22 -16.97 1.20 1.70 -2.45 The realized volatilities of the portfolios are in agreement with their names; the LOW risk had 5.49% annualized volatility, the MID had 13.37%, while the HIGH had 20.22%. Also, please notice the strong correlation between the returns CAGR and volatility of the portfolios. On the other hand, during 2015 the LOW volatility portfolio produced a positive return of 1.75%, while the MID and HIGH risk portfolio suffered negative returns. In figure 1 we show the graphs of the portfolio equities for the period from January 2007 to October 2015. (click to enlarge) Figure 1. Equity curves for three portfolios adaptively optimized for low, medium and high risk targets. Source: All charts in this article are based on EXCEL calculations using the adjusted daily closing share prices of securities. In figure 2, 3 and 4 we show the time variation of the percentage allocation of the funds for the period since January 2014 to October 2015. We opted for this shorter time period to get graphs that are easily readable. We are mostly interested in the allocations during 2015. (click to enlarge) Figure 2. Percentage allocation of the funds for low risk portfolio January 2014 to October 2015. One can see in figure 2 that most of the time the portfolio was invested about 50% in the short term treasury fund FSBIX. In figure 3 we show the time variation of the percentage allocation of the funds for mid risk. (click to enlarge) Figure 3. Percentage allocation of the funds for MID risk portfolio January 2014 to October 2015. (click to enlarge) Figure 4. Asset allocations for the portfolio adaptively optimized for the HIGH risk target January 2014 to October 2015.. Since July 2015 the high risk portfolio was invested 100% in treasuries; in FSLBX in July and August, and in FIBIX in September and October. The current fund allocations are shown in table 3. Table 3. Asset allocations for October 2015 FSELX FBMPX FSPHX FSCHX FLBIX FIBIX FSBIX LOW risk 0% 0% 0% 0% 0% 0% 100% MID risk 0% 0% 0% 0% 88% 0% 12% HIGH risk 0% 0% 0% 0% 0% 100% 0% Conclusion The low risk Fidelity select portfolio performed better than the mid and high risk portfolios. While the return of 1.75% is relatively modest, it is better than many other choices. The losses of the mid risk portfolio are very small at -0.49%, while the high risk portfolio lost the most at -2.45%. In hindsight, investing in a low risk portfolio was the better choice due to the fact that the market environment was very difficult since the beginning of 2015.

Will A Fidelity Select Funds Portfolio Perform Well In A Rising Interest Rates Environment?

Summary Old portfolio: FBMPX, FSCHX, FSELX, FSPHX, FGMNX. New portfolio: FBMPX, FSCHX, FSELX, FSPHX, FIBIX, FSBIX. The new portfolio significantly outperforms the old one. In a previous article , we presented the performance of a portfolio made up of five Fidelity select mutual funds. That portfolio had a stellar performance over the whole 27-year period from 1987 to 2015, but we are concerned about its performance in a stock bear market within a rising interest rate environment. To increase its robustness for such events, we decided to replace the GNMA fund (MUTF: FGMNX ) with two high-quality government bonds. The portfolio is made up of the following funds: Fidelity Select Multimedia Portfolio No Load (MUTF: FBMPX ) Fidelity Select Chemicals Portfolio No Load (MUTF: FSCHX ) Fidelity Select Electronics Portfolio No Load (MUTF: FSELX ) Fidelity Select Medical Delivery Portfolio No Load (MUTF: FSHCX ) Fidelity Spartan Intermediate Trust Bond Index Fund Inv (MUTF: FIBIX ) Fidelity Spartan Short Term Trust Bond Index Fund Inv (MUTF: FSBIX ) Our old portfolio performed very well during the two big bear markets of 2000-03 and 2008-09. During those markets, the portfolio was invested mostly in the GNMA fund that experienced growth due to declining interest rates associated with economic contraction. But if a stock bear market happens while interest rates are rising, the GNMA fund most likely would not offer protection. We expect that a short-term government bond would allow the portfolio capital to be preserved during such adverse market environments. Due to their low sensitivity to interest rates, the short-term Treasury bonds act mostly as cash. Basic information about the funds was extracted from Yahoo Finance and is shown in the table below. Table 1 Symbol Inception date Net assets Yield% Category FSELX 7/29/1985 2.32B 0.47% Technology FBMPX 6/30/1986 803M 0.24% Consumer Cyclical FSPHX 7/14/1981 10.75B 1.90% Health FSCHX 7/29/1985 1.47B 1.02% Natural Resources FIBIX 12/20/2005 1.35B 1.90% Intermediate Term Treasuries FSBIX 12/20/2005 863M 0.76% Short Term Treasuries Since the historical price data of the bond funds is available only from December 2005 on, and we need 65 trading days for estimating market parameters, we were able to simulate our optimal allocation strategy starting with April 2006. We performed an analysis of the difference in performance of the old and the new portfolios. The data for the study were downloaded from Yahoo Finance , using the Historical Prices menu for FGMNX, FBMPX, FSCHX, FSELX, FSPHX, FIBIX, and FSBIX, respectively. We use the daily price data adjusted for dividend payments. The portfolio is managed as dictated by a variance-return optimization algorithm developed on the Modern Portfolio Theory ( Markowitz ). The allocation is rebalanced monthly at market closing of the first trading day of the month. In table 2 below, we present the performance of the new portfolio for three levels of risk. Table 2. Portfolio performance from April 2006 to June 2015 TotRet% CAGR% No. of trades maxDD% VOL% Sharpe Sortino Low risk 247.96 14.41 112 -8.02 8.81 1.63 2.27 Medium risk 363.25 18 108 -9.86 12.35 1.46 2.01 High risk 457.9 20.39 94 -13.26 15.01 1.36 1.9 SPY 91.37 7.26 0 -55.18 20.98 0.35 0.41 In figure 1, we show the graphs of the portfolio equities. (click to enlarge) Figure 1. Equity curves for three portfolios adaptively optimized for low-, medium- and high-risk targets. Source: This chart is based on EXCEL calculations, using the adjusted monthly closing share prices of securities. In figure 2 below, we show the time variation of the percentage allocation of the funds for medium risk. (click to enlarge) Figure 2. Asset allocations for the new portfolio adaptively optimized for the medium risk target Source: This chart is based on EXCEL calculations, using the adjusted monthly closing share prices of securities. In figure 2, it can be observed that during the bear market of 2008-09, most money was allocated to the intermediate-term bond fund, FIBIX. During the market corrections of 2010 and 2011, most money was allocated to the short-term bond fund, FSBIX. The current fund allocations are shown in table 3. Table 3. Asset allocations for July 2015 FSELX FBMPX FSPHX FSCHX FIBIX FSBIX Low risk 30% 70% 0% 0% 0% 0% Medium risk 0% 100% 0% 0% 0% 0% High risk 0% 100% 0% 0% 0% 0% We also simulated the performance of the old portfolio over the same time period from April 2006 to June 2015 and for the same risk levels. Consistently over the whole simulation period, the new portfolio outperformed the old one by about a 40% increase in annual returns and a 20% or more decrease in maximum drawdown. We compared the returns of the portfolios over the bear market of 2008 and the market corrections of 2010 and 2011. The results are shown in table 4. Table 4. Total returns of the portfolios during market downturns Time Period SPY Old Portfolio New Portfolio 12/2007 – 3/2009 -48.92 -11.08% 9.74% 3/2010 – 7/2010 -10.95 -5.75% -0.30% 4/2011 – 9/2011 -16.22 -1.59% 15.51% From table 4, it is clear that the new portfolio performs better than the old one, and that it is very robust to market downturns. Unfortunately, there were no long enough periods of rising interest rates to allow us to make any judgment about the behavior of the portfolios during such times. It is our belief that in a long period of rising interest rates, the new portfolio will suffer only small losses by parking the money in the short-term bond fund. Conclusion The modified Fidelity portfolio performed significantly better than the old one. It even made gains during the 2008 bear market and the 2011 market correction. While there is no empirical data to prove it, we believe that the new portfolio is robust and will perform well even during a prolonged period of rising interest rates. Disclosure: I am/we are long FSELX, FSPHX. (More…) I wrote this article myself, and it expresses my own opinions. I am not receiving compensation for it (other than from Seeking Alpha). I have no business relationship with any company whose stock is mentioned in this article.