Tag Archives: fn-start

The Rolling Stones Understand Long-Duration Investing

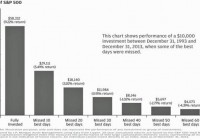
Summary Many investors have short-term horizons. Short-duration investors can miss major market gains. We think long-duration investing creates wealth over long periods of time. Time is on my side, yes it is. Time is on my side, yes it is. Now you all were saying that you want to be free But you’ll come runnin’ back, You’ll come runnin’ back, You’ll come runnin’ back to me. It’s only after the animals are out of the barn that investors want to close the door. This means attempting to make most of the money from participating in common stocks, but somehow regularly going to cash in the worst declines. Consider the aftermath of the 2007-09 financial meltdown and bear market, when asset allocators first looked to those active equity funds which weathered the 2008 storm the best. You want to make money in stocks, but you “want to be free.” So it seems that every time there is a substantial bear market in U.S. stocks, market timing pops to the center of the investing conversation. At Smead Capital Management, our 34 years of market observation has yet to find anyone or any system which did this successfully. The chart below shows why “time is on my side” for the long-duration investor: (click to enlarge) You’re searching for good times but just wait and see, You’ll come runnin’ back, You’ll come runnin’ back, You’ll come runnin’ back to me. Once market participants decide they want to be involved in a bull market, they have a tendency to seek out the most exciting growth companies of the era. Warren Buffett cautioned, “Investors should remember that excitement and expense are their enemies.” Fama-French, Bauman-Conover-Miller, David Dreman and Francis Nicholson all proved academically that the cheapest stocks outperformed the average and the most expensive stocks over one-year and multiple-year time periods. At Smead Capital Management, we strive to be long-duration investors in the shares of companies which are both quantitatively cheaper and qualitatively above average in significant ways. We expect over time that investors will “come runnin’ back” into ownership of businesses which match our eight criteria for stock selection. It takes contrarianism and patience. One of the best examples of the combination of cheapness and quality we’ve seen was four years ago in the pharmaceutical/biotech industry of the S&P 500 Index. In the key areas of profit consistency, free cash flow and balance sheet, these were stars. And they were priced as if they’d never have another new product. In case anyone wonders, the humility and contentiousness of these kinds of situations can take three to five years to play out. We were fortunate to have some other parts of our portfolio succeeding for us back then, and a loyal/patient group of long-duration investors along for the ride. Go ahead baby, go ahead, go ahead and light up the town! And baby, do anything your heart desires Remember, I’ll always be around. And I know, I know like I told you so many times before You’re gonna come back, Yeah you’re going to come back baby In the current environment, investors’ “heart desires” are to have the comfort of being in every sector and every company of the S&P 500 Index, so that they are sure to have some winning tickets in the horse race. They are “lighting up the town,” and seem able to benefit from the cost advantage inherent in indexing. For those who don’t have access to a high-margin-of-safety/long-duration investing discipline or the predilection to practice one themselves, owning numerous un-meritorious and overpriced companies mixed in with a minority of worthy ones provides a minimally adequate way to participate for the long term. How many investors send their kids off for higher education with instructions to accept way less than excellent long-term academic results from the least expensive college? We believe that “time is on the side” of the long-duration investor who applies quantitative and qualitative screening and the long-term holding of common stocks. When the S&P 500 Index stumbles, like it did after the tech bubble broke in 2000, “we’ll be around” and expect many index investors are “going to come back baby.” Remember what John Maynard Keynes said about investing, “[Investing] is the one sphere of life and activity where victory, security and success is always to the minority and never to the majority. When you find any one agreeing with you, change your mind.” Passive investing in the U.S. large-cap equity space appears to no longer be in the minority, as this year’s overwhelming money flows have proven. We are not bothered even if the current trend continues, because our long-duration goals include “victory, security and success.” The information contained in this missive represents SCM’s opinions, and should not be construed as personalized or individualized investment advice. Past performance is no guarantee of future results. Bill Smead, CIO and CEO, wrote this article. It should not be assumed that investing in any securities mentioned above will or will not be profitable. A list of all recommendations made by Smead Capital Management within the past twelve month period is available upon request.

GDXJ Re-Balancing Pummels These 5 Gold Developers

The Market Vectors Junior Gold Miners ETF (NYSEARCA: GDXJ ) is an ETF administered by Van Eck and created to replicate the Global Junior Gold Miners Index which is a basket of small-cap gold exploration, development and production companies. The GDXJ tries to maintain an average market cap of its holdings above $150 million. According to recent filings, the ETF’s largest holdings are Centamin ( OTCPK:CELTF ), IAMGOLD (NYSE: IAG ), Hecla (NYSE: HL ) and AuRico (NYSE: AUQ ), but included in the 69 total equity positions are exploration names such as Bear Creek Mining ( OTCPK:BCEKF ) and Focus Minerals ( OTCPK:FKSMF ). Needless to say, the ETF which mirrors the junior resource markets, hasn’t performed well. Year-to-date, it is down 18.18% but in the past 3 months the ETF is down over 40%. Recently, the GDXJ was re-balanced in order to maintain their average market capitalization hurdle. Given the performance of the underlying equities, the pre-revenue, development stories that have become less and less liquid were sold in favor of more liquid, higher market capitalization names such as IAMGOLD, AuRico and Alamos (NYSE: AGI ). As a result, some of these development companies have been crushed by this relentless selling. Asanko (NYSEMKT: AKG ), Premier Gold ( OTCPK:PIRGF ), Torex ( OTCPK:TORXF ), Rubicon (NYSEMKT: RBY ) and Midway (NYSEMKT: MDW ) were among them. Shares in those companies are down 23%, 25%, 22%, 17% and 15%, respectively over the past 30 days. Last Friday saw huge volume traded in these names as well. Asanko traded 28 million shares on Friday alone. The average daily volume traded over the past 3 months in Asanko is just 156,500 shares (the other names were similar). These companies have all outperformed the GDXJ year-to-date. Torex is up 24%, Premier up 19%, Rubicon up 8%, Asanko is flat on the year, Midway down 11%. The GDXJ on the other hand was down 25%. So perhaps the decision to cut these outperforming names wasn’t the best call afterall? Regardless, these teams have significantly de-risked their projects. Below is a summary of the milestones achieved this year: Torex – closed a $145 million equity financing and another $375 million project finance facility to build their Morelos project which is one of the highest-grade undeveloped open-pit gold projects in the world. They moved the construction of their project forward on time and on budget for a mid-2016 commercial production start-up. They also got $85 million worth of at-the-money warrants exercised (of $90 million) and made significant strides towards the development of their second mine, Media Luna. I doubt this company would get acquired before they complete construction and ramp-up, but come mid-to-late 2016 when the mine is running smoothly, I would expect a major to take them out (and likely at a significant premium). Since June 30, 2014, the GDXJ has sold 65.9 million Torex Gold shares in the market reducing their position by 57 Premier Gold – released a positive PEA on their Hardrock and Brookbank projects and followed that up with meaningful exploration results at their Cove Gold project. Recently, they were able to raise $9 million to continue de-risking these Canadian high-grade gold projects. Although earlier-stage, Premier could see a takeover bid come from one of the many companies looking for Canadian exposure to add to their project pipeline. Since June 30, 2014, the ETF sold 29.6 million shares, reducing their position by 73%. Rubicon Minerals – started the year with a $75 million streaming deal from Royal Gold, then followed that up with a $115 million bought deal financing. They continued to advance the construction of their Phoenix Gold project which they are touting as “Canada’s next high-grade gold mine”. With what management has delivered on so far and the expected production start-date of mid-2015, we believe that statement could prove to be true. Given the recent flight to safety by many global miners (see Osisko takeover battle), we view Rubicon as another likely takeover candidate given its postal code. 31.5 million shares of Rubicon have hit the market since June 30th, courtesy of the GDXJ. They reduced their position by 56%. Asanko Gold – had a truly transformational year. They successfully closed the acquisition of PMI Gold for roughly $180 million worth of stock in order to consolidate the two companies neighboring gold assets in Ghana. Shortly after, the company decided that the newly acquired, higher-grade mine from PMI would become the phase 1 project and outlined a path to get to 200,000 ounces of annual gold production by 2016. The company continued to de-risk the phase 1 development and worked on developing an integration plan for the second phase development which could see the company’s production double from 200,000 ounces to 400,000 ounces of gold annually, effectively catapulting the company into the mid-tier ranks. Next year looks to be another exciting year as the company completes construction and formally outlines the integration plan of the second phase of production. With Asanko’s board and management, this company could be a takeover target or could continue acquiring assets to grow their production profile. Asanko Gold saw its weighting in the GDXJ reduced by 37.9 million shares or roughly 77% since June 30th. Midway – broke ground on their heap leach gold project in Nevada and followed that up with the formalization of a joint venture with Barrick on the Spring Valley project which will see Midway carried to production at a 25% interest should Barrick chose to build it. Midway also announced the finalization of a project finance facility of $55 million and $25 million bought deal financing which allows the company to finish building Pan. The project is one of very few run-of-mine projects (means no crushing necessary) which enables it to be both technically straight forward as well as lower cost than other mines, making it a takeover candidate for anyone looking for simple heap leach projects in safe jurisdictions (of which there are many companies). Midway Gold saw the fewest shares hit the market with just 8.7% of its weighting in the GDXJ eliminated (roughly 1.1 million shares). Overall, the recent selloff in these names should be taken in context. All of the above teams are delivering on their promises, meeting or exceeding expectations, de-risking their projects and moving towards cash flow. An unrelated index re-balancing sale of these companies’ shares provide an opportunity for us as resource speculators. This is one of those times where I, as a speculator, finding myself questioning my investment thesis. Am I missing something? Does the market know something I don’t? In this case, I believe the selloff in the names is unrelated to the specific companies themselves or even the broader markets in general; it’s just a portfolio manager with a heavy finger. As a result, this re-balancing combined with the fact we are in the final days of tax-loss season provides an opportunity to gain exposure to high-quality gold development names. Disclosure: None Editor’s Note: This article covers one or more stocks trading at less than $1 per share and/or with less than a $100 million market cap. Please be aware of the risks associated with these stocks.

Momentum And Rebalancing Of Retirement Income Portfolios

Summary Robust investment portfolios can be constructed with just two ETFs: one representing the total stock market and another representing the total bond market. From November 2003 to December 2014, the ETF portfolio with fixed allocation allowed a safe 4% annual withdrawal rate and achieved a 28.95% increase of the capital. Better returns were achieved by rebalancing the portfolio at 25% deviation from the target weights. Capital increased by 43.66%, average annual return of 3.35%. Radically better performance is achievable using adaptive asset allocation. With a safe 4% withdrawal rate, the capital increased by 164.93%, average annual return of 9.26%. ETF portfolio performs essentially the same as its mutual fund counterparts. The comparison of their performance is evident in the tables included in the article. In a couple of recent articles , we demonstrated that a very simple and well diversified portfolio may be made up of two instruments, one representing the total stock market, and the other the total bond market. These portfolios are quite robust and achieve decent returns using simple strategies as rebalancing and momentum based adaptive allocation. At the suggestion of some readers, we investigate the suitability of these portfolios as retirement investments for income generation and capital appreciation. From many possibilities, I selected the following three portfolios: one built with iShares and Vanguard ETFs, the second with Vanguard mutual funds, and the third with Fidelity mutual funds. ETFs portfolio: iShares Core US Aggregate Bond Market ETF (NYSEARCA: AGG ) and Vanguard Total Stock Market ETF (NYSEARCA: VTI ). Mutual funds portfolio: Vanguard Total Bond Market Index Fund (MUTF: VBMFX ) and Vanguard Total Stock Market Index Fund (MUTF: VTSMX ). Mutual funds portfolio: Fidelity Total Bond Market Index Fund (MUTF: FTBFX ) and Fidelity Spartan Total Stock Market Index Fund (MUTF: FSTMX ). For purposes of comparison we simulate these portfolios from November 2003 to December 2014, a total of eleven years. The time period of the study was selected based on the availability of historical data of the investment instruments; AGG was created in September 2003. In this article, three different strategies will be considered: Portfolio is 50% stocks and 50% bonds without rebalancing. Portfolio is created with 50% stocks and 50% bonds; it is rebalanced when the allocation deviates by 25% from the 50 target, when the allocations become 62.5% and 37.5%. Portfolio is at all times invested 100% in either stocks, or bonds. The switching, if necessary, is done monthly at closing of the last trading day of the month. All the funds are invested in the instrument with the highest return over the previous 3 months. The data for the study were downloaded from Yahoo Finance on the Historical Prices menu for the six tickers. We use the monthly price data from September 2003 to November 2014, adjusted for stock splits and dividend payments. The time selection is restricted by the availability of data; AGG was created in September 2003. Portfolios with fixed weights with withdrawals, no rebalancing Assume that we have $1,000,000 to invest for income in retirement. We plan to withdraw 4% annually plus a 2% inflation adjustment. The withdrawals are done monthly. Over the 11 years from 2003 to 2014, a total of $488,000 was withdrawn. The first table shows the results of the portfolios created with 50% AGG and 50% VTI, and their Vanguard and Fidelity mutual fund counterparts. The monthly withdrawal is done such a way that the weights of the two components are brought back toward the target of 50-50. Below, we show the hypothetical behavior of these equal weight portfolios from November 2003 to December 2014. The maximum drawdowns of the portfolios are larger than that of the same portfolios without income withdrawals, because the withdrawals decrease the equity. On the average the returns are greater than the withdrawals, so the total capital is increasing . The CAGR columns give the cumulative average growth rate of the capital. Table 1. Fixed allocation portfolios without rebalancing CAGR% Max DD % Final Equity AGG + VTI 2.40 -28.29 1,298,500 VTSMX + VBMFX 2.40 -28.34 1,298,100 FSTMX + FTBFX 3.05 -32.75 1,392,100 The plots of the portfolios are shown in figure 1. The values are shown in percentages of the initial investment. (click to enlarge) Figure 1. Equities of portfolios with 4% annual withdrawal without rebalancing. Source: This chart is based on EXCEL calculations using the adjusted monthly closing share prices of securities. Portfolios with fixed weights with withdrawals and rebalancing As before, we assume that we have $1,000,000 to invest for income in retirement. We plan to withdraw 4% annually plus a 2% inflation adjustment. Over the 11 years from 2003 to 2014, a total of $488,000 was withdrawn. The only difference of the strategy is that we rebalance the portfolio when the allocation between stocks and bonds deviates by 25% from the 50% target. The rebalance happens when the allocations become 62.5% and 37.5%. During the 11 years of our study there was only one rebalancing. But, as can be seen in Table 2, the rebalance contribute to a substantial increase in returns. Table 2. Fixed allocation portfolios with rebalancing CAGR% Max DD % Final Equity AGG + VTI 3.35 -28.29 1,436,600 VTSMX + VBMFX 3.31 -28.34 1,430,800 FSTMX + FTBFX 3.45 -32.75 1,451,700 The plots of the portfolios are shown in figure 2. The values are shown in percentages of the initial investment. (click to enlarge) Figure 2. Equities of portfolios with 4% annual withdrawal and rebalancing. Source: This chart is based on EXCEL calculations using the adjusted monthly closing share prices of securities. To appreciate the improvement obtained by rebalancing, in figure 3 are shown the equities for the ETF portfolio with and without rebalancing. (click to enlarge) Figure 3. ETF portfolios with fixed allocations Source: This chart is based on EXCEL calculations using the adjusted monthly closing share prices of securities. Adaptive Asset Allocation What we presented so far is a robust example from which one can infer that portfolio rebalancing has some positive effect in improving returns of a retirement investment. Another approach, with significant better results is to apply an adaptive asset allocation based on price momentum. We consider again the ETF portfolio of VTI and AGG by switching between two allocations: 100% AGG and 0% VTI 0% AGG and 100% VTI The switching is done monthly, on the last trading day of the month, using the following rule: invest fully in the asset with the highest return during the most recent 3 months. From November 2003 to November 2014, there were 25 reallocations of the ETF portfolio. The system was invested 88 months in VTI, and 44 months in AGG. The adaptive allocation system based on momentum achieved much higher return and lower drawdown than the fixed allocation system with or without rebalancing. Similar results were obtained with the Vanguard and Fidelity mutual funds. Those portfolios required 27 reallocations during the 11 years of the study. The Vanguard portfolio was invested 87 months in VTSMX, and 45 months in VBMFX. The Fidelity portfolio was invested 87 months in FSTMX, and 45 months in FTBFX. Table 3. Adaptive allocation portfolios CAGR% Max DD % Final Equity AGG + VTI 9.26 -18.18 2,649,300 VTSMX + VBMFX 8.22 -18.67 2,384,300 FSTMX + FTBFX 7.61 -24.97 2,241,700 The plots of the portfolios are shown in figure 1. The values are shown in percentages of the initial investment. (click to enlarge) Figure 4. Adaptive Allocation Portfolios Source: This chart is based on EXCEL calculations using the adjusted monthly closing share prices of securities. Conclusion The adaptive allocation algorithm performed substantially better than the fixed allocation algorithms regardless of the type of market. It generated much higher returns with lower risk. For a comparison see figure 5. (click to enlarge) Figure 5. ETF portfolios with monthly withdrawals 2003-2011. Source: This chart is based on EXCEL calculations using the adjusted monthly closing share prices of securities.